
Beneath every trend line and chart pattern lies a simpler language: the pattern of highs and lows that price makes as it swings up and down. Learning to read higher highs, lower lows, and the rest is the foundation of market structure, and it lets you define a trend precisely rather than by feel. Here is how swing points map to uptrends, downtrends, and ranges, and what it means when the pattern breaks.
Swing highs and swing lows
As price moves, it does not go in a straight line; it swings, making peaks and troughs. A swing high is a peak where price turned down, and a swing low is a trough where price turned up. These swing points are the skeleton of market structure. By comparing each new swing high and swing low to the previous one, higher or lower, you can read the trend objectively rather than guessing, which is what makes structure so useful.
What an uptrend looks like
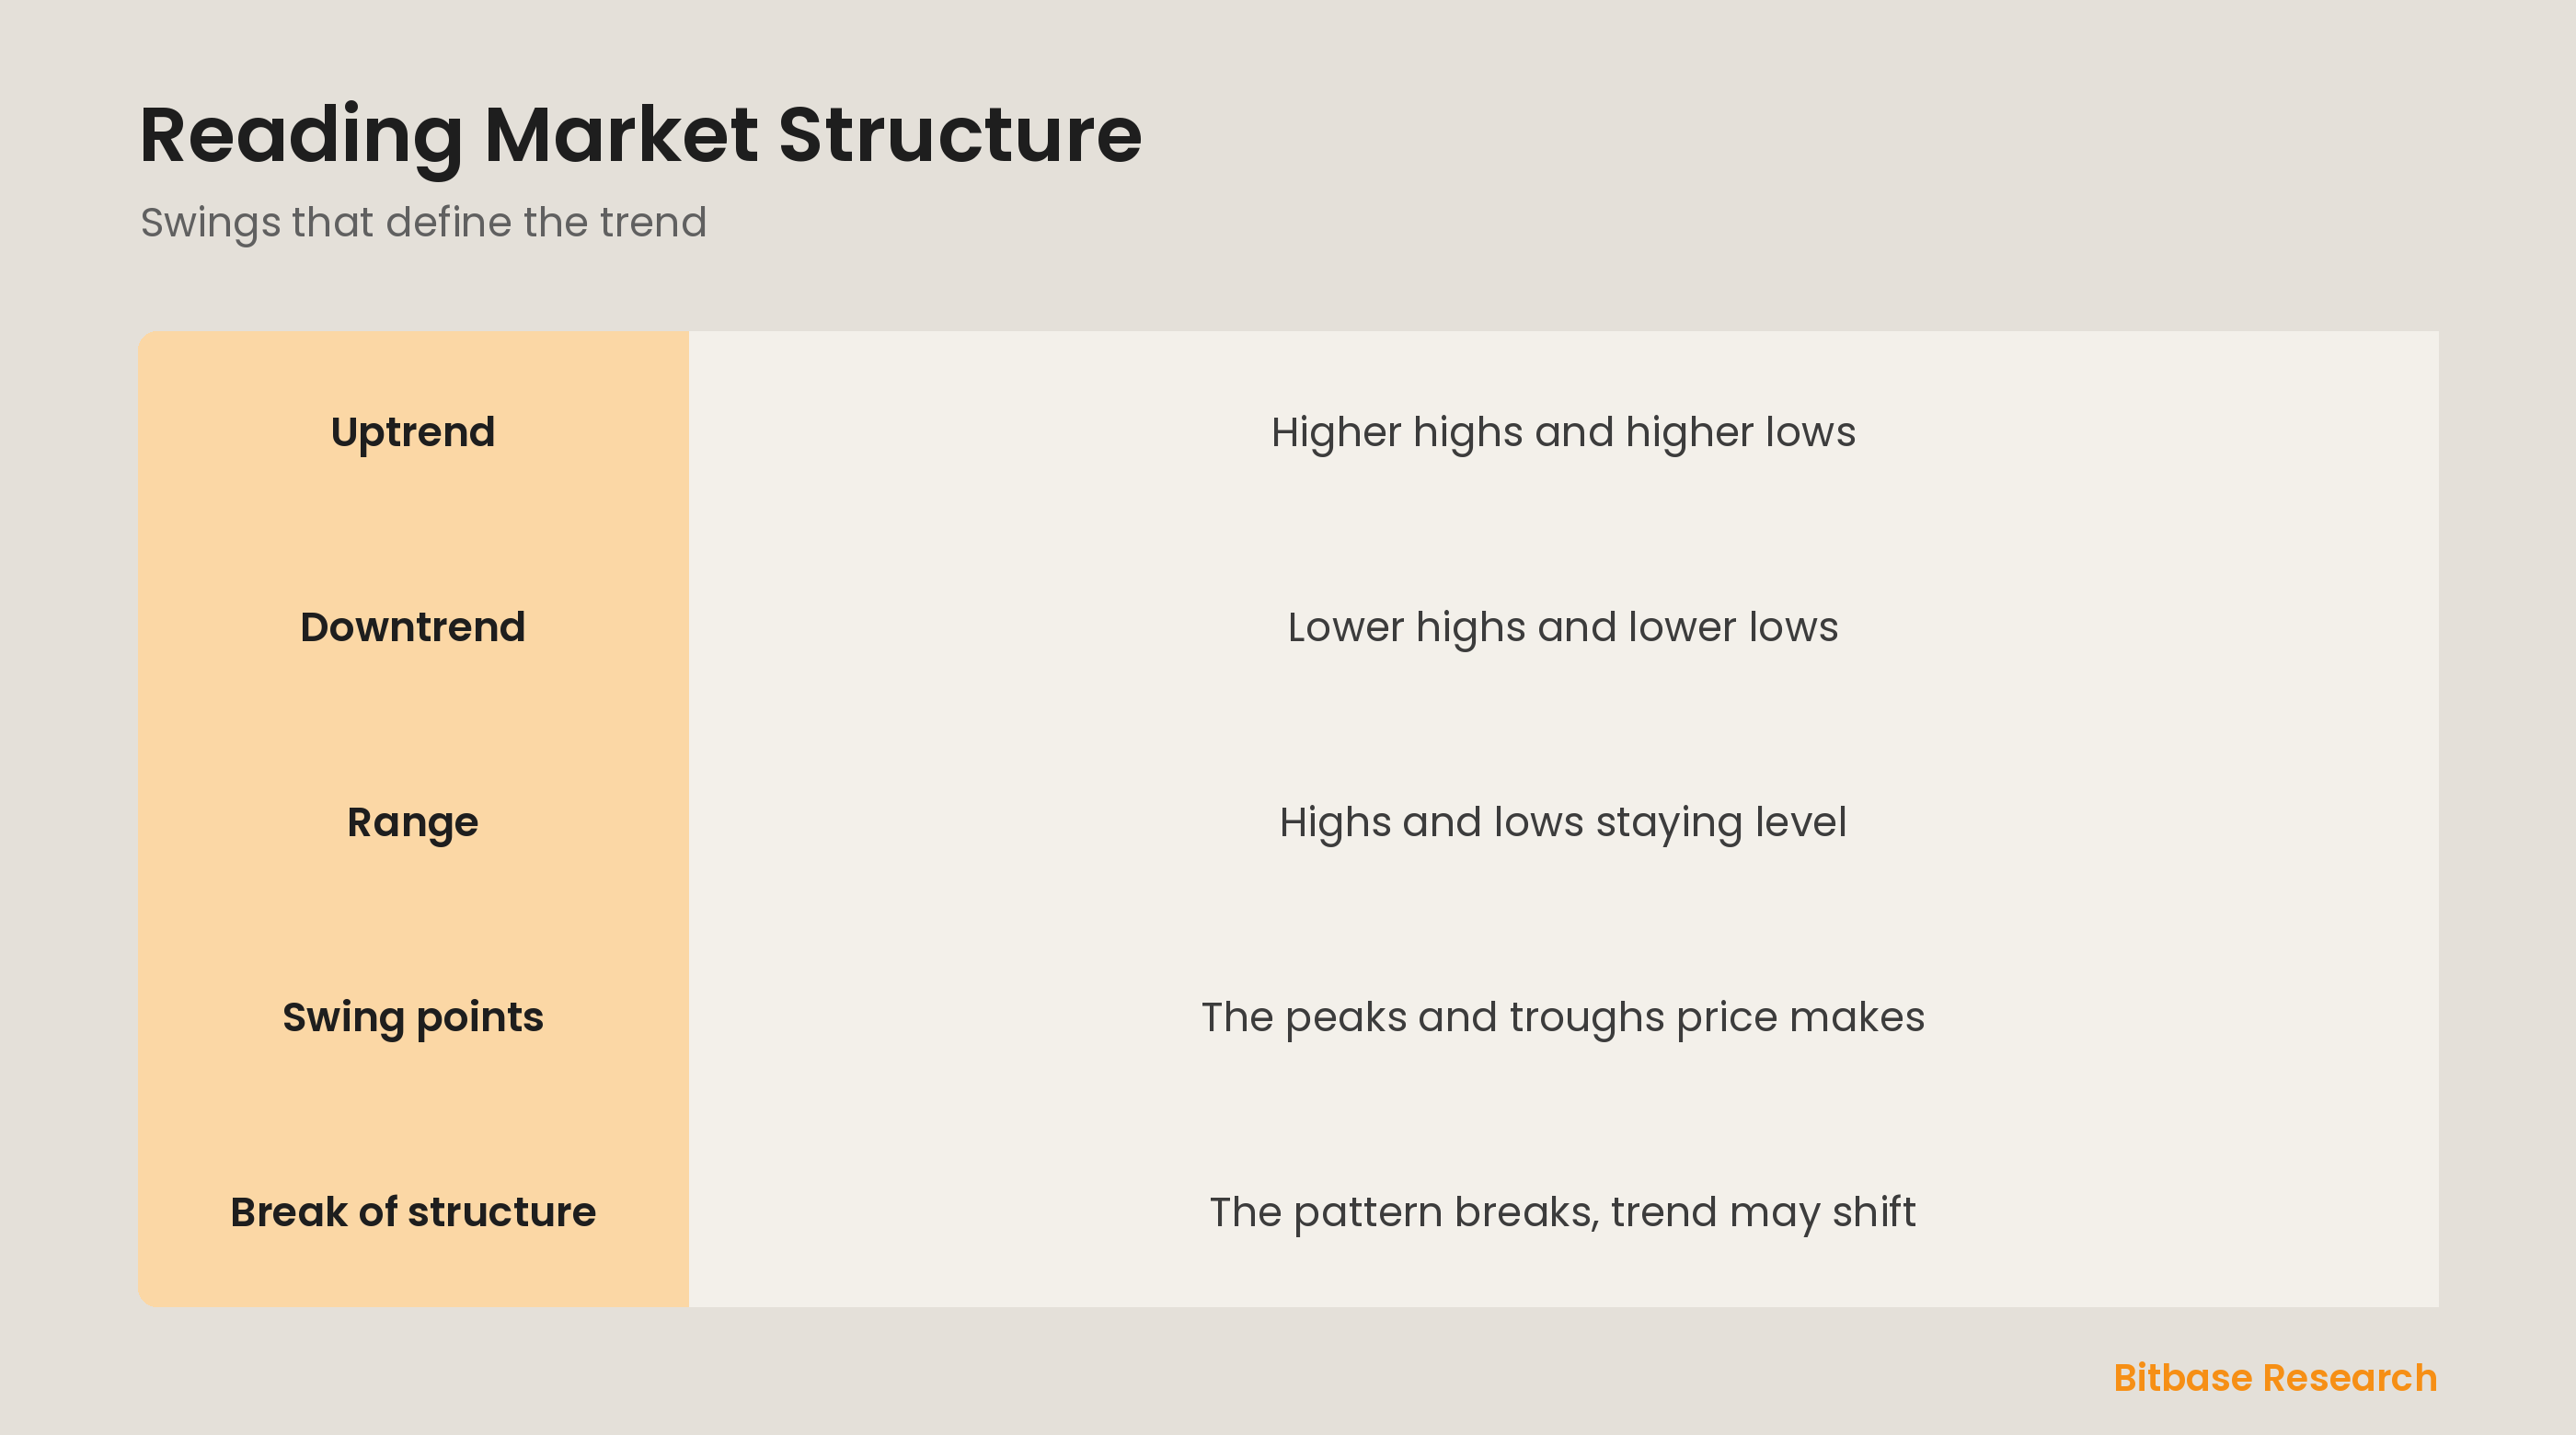
An uptrend, in structural terms, is a sequence of higher highs and higher lows. Each peak reaches above the last peak, and each pullback bottoms above the previous trough. This stair-stepping pattern is the clearest definition of an uptrend: buyers keep pushing to new highs, and even the dips find support at progressively higher levels. As long as price keeps making higher highs and higher lows, the uptrend is structurally intact.
Downtrends and ranges
A downtrend is the mirror image: a sequence of lower highs and lower lows, where each rally fails below the last and each drop bottoms below the previous one, a downward staircase. A range, by contrast, is when highs and lows stop progressing and stay roughly level, with price swinging between similar peaks and troughs. Reading these three patterns of swing points tells you at a glance whether the market is trending up, trending down, or going sideways.
A break of structure
The pattern is most powerful when it breaks. In an uptrend of higher highs and higher lows, the first time price makes a lower low, breaking below a prior swing low, it signals the structure has shifted and the uptrend may be ending. Likewise, a downtrend making its first higher high hints at a possible turn up. This break of structure is an objective early signal that the trend you were reading may be changing character.
The bottom line
Market structure is read through swing highs and swing lows: an uptrend makes higher highs and higher lows, a downtrend makes lower highs and lower lows, and a range keeps them level. This gives an objective definition of the trend instead of a guess. A break of structure, such as an uptrend suddenly making a lower low, is an early signal that the trend may be shifting, making swing points one of the most useful reads on any chart. To keep learning the fundamentals, follow more from Bitbase Academy.
Disclaimer: This article is educational content from Bitbase Academy, provided for information only. It does not constitute investment, trading, tax, or financial advice. Crypto assets are volatile; assess your own risk. Written as of June 2026; refer to the latest official information.
References
[1] Investopedia, "Trend: Definition, Types, Examples, and Uses in Trading" investopedia.com
[2] Investopedia, "Price Action: What It Is and How Stock Traders Use It" investopedia.com
[3] Investopedia, "Technical Analysis: What It Is and How to Use It" investopedia.com