
A single candle with a long tail can say a lot about who won a battle during the period. The hammer and the shooting star are two such candles, each defined by a long wick that shows price pushed hard in one direction, then got shoved back. That rejection is why traders treat them as reversal hints. Here is what each looks like, what the wick is telling you, and where they carry the most meaning.
What a hammer is
A hammer is a candle with a small body near the top and a long lower wick, so it looks like a hammer or a mallet. The long lower wick means price fell sharply during the period but was then bought back up, closing near where it opened. That shows sellers tried to push lower and failed, with buyers stepping in to reject the lows. It is a sign of buying pressure emerging from below.
Where a hammer matters
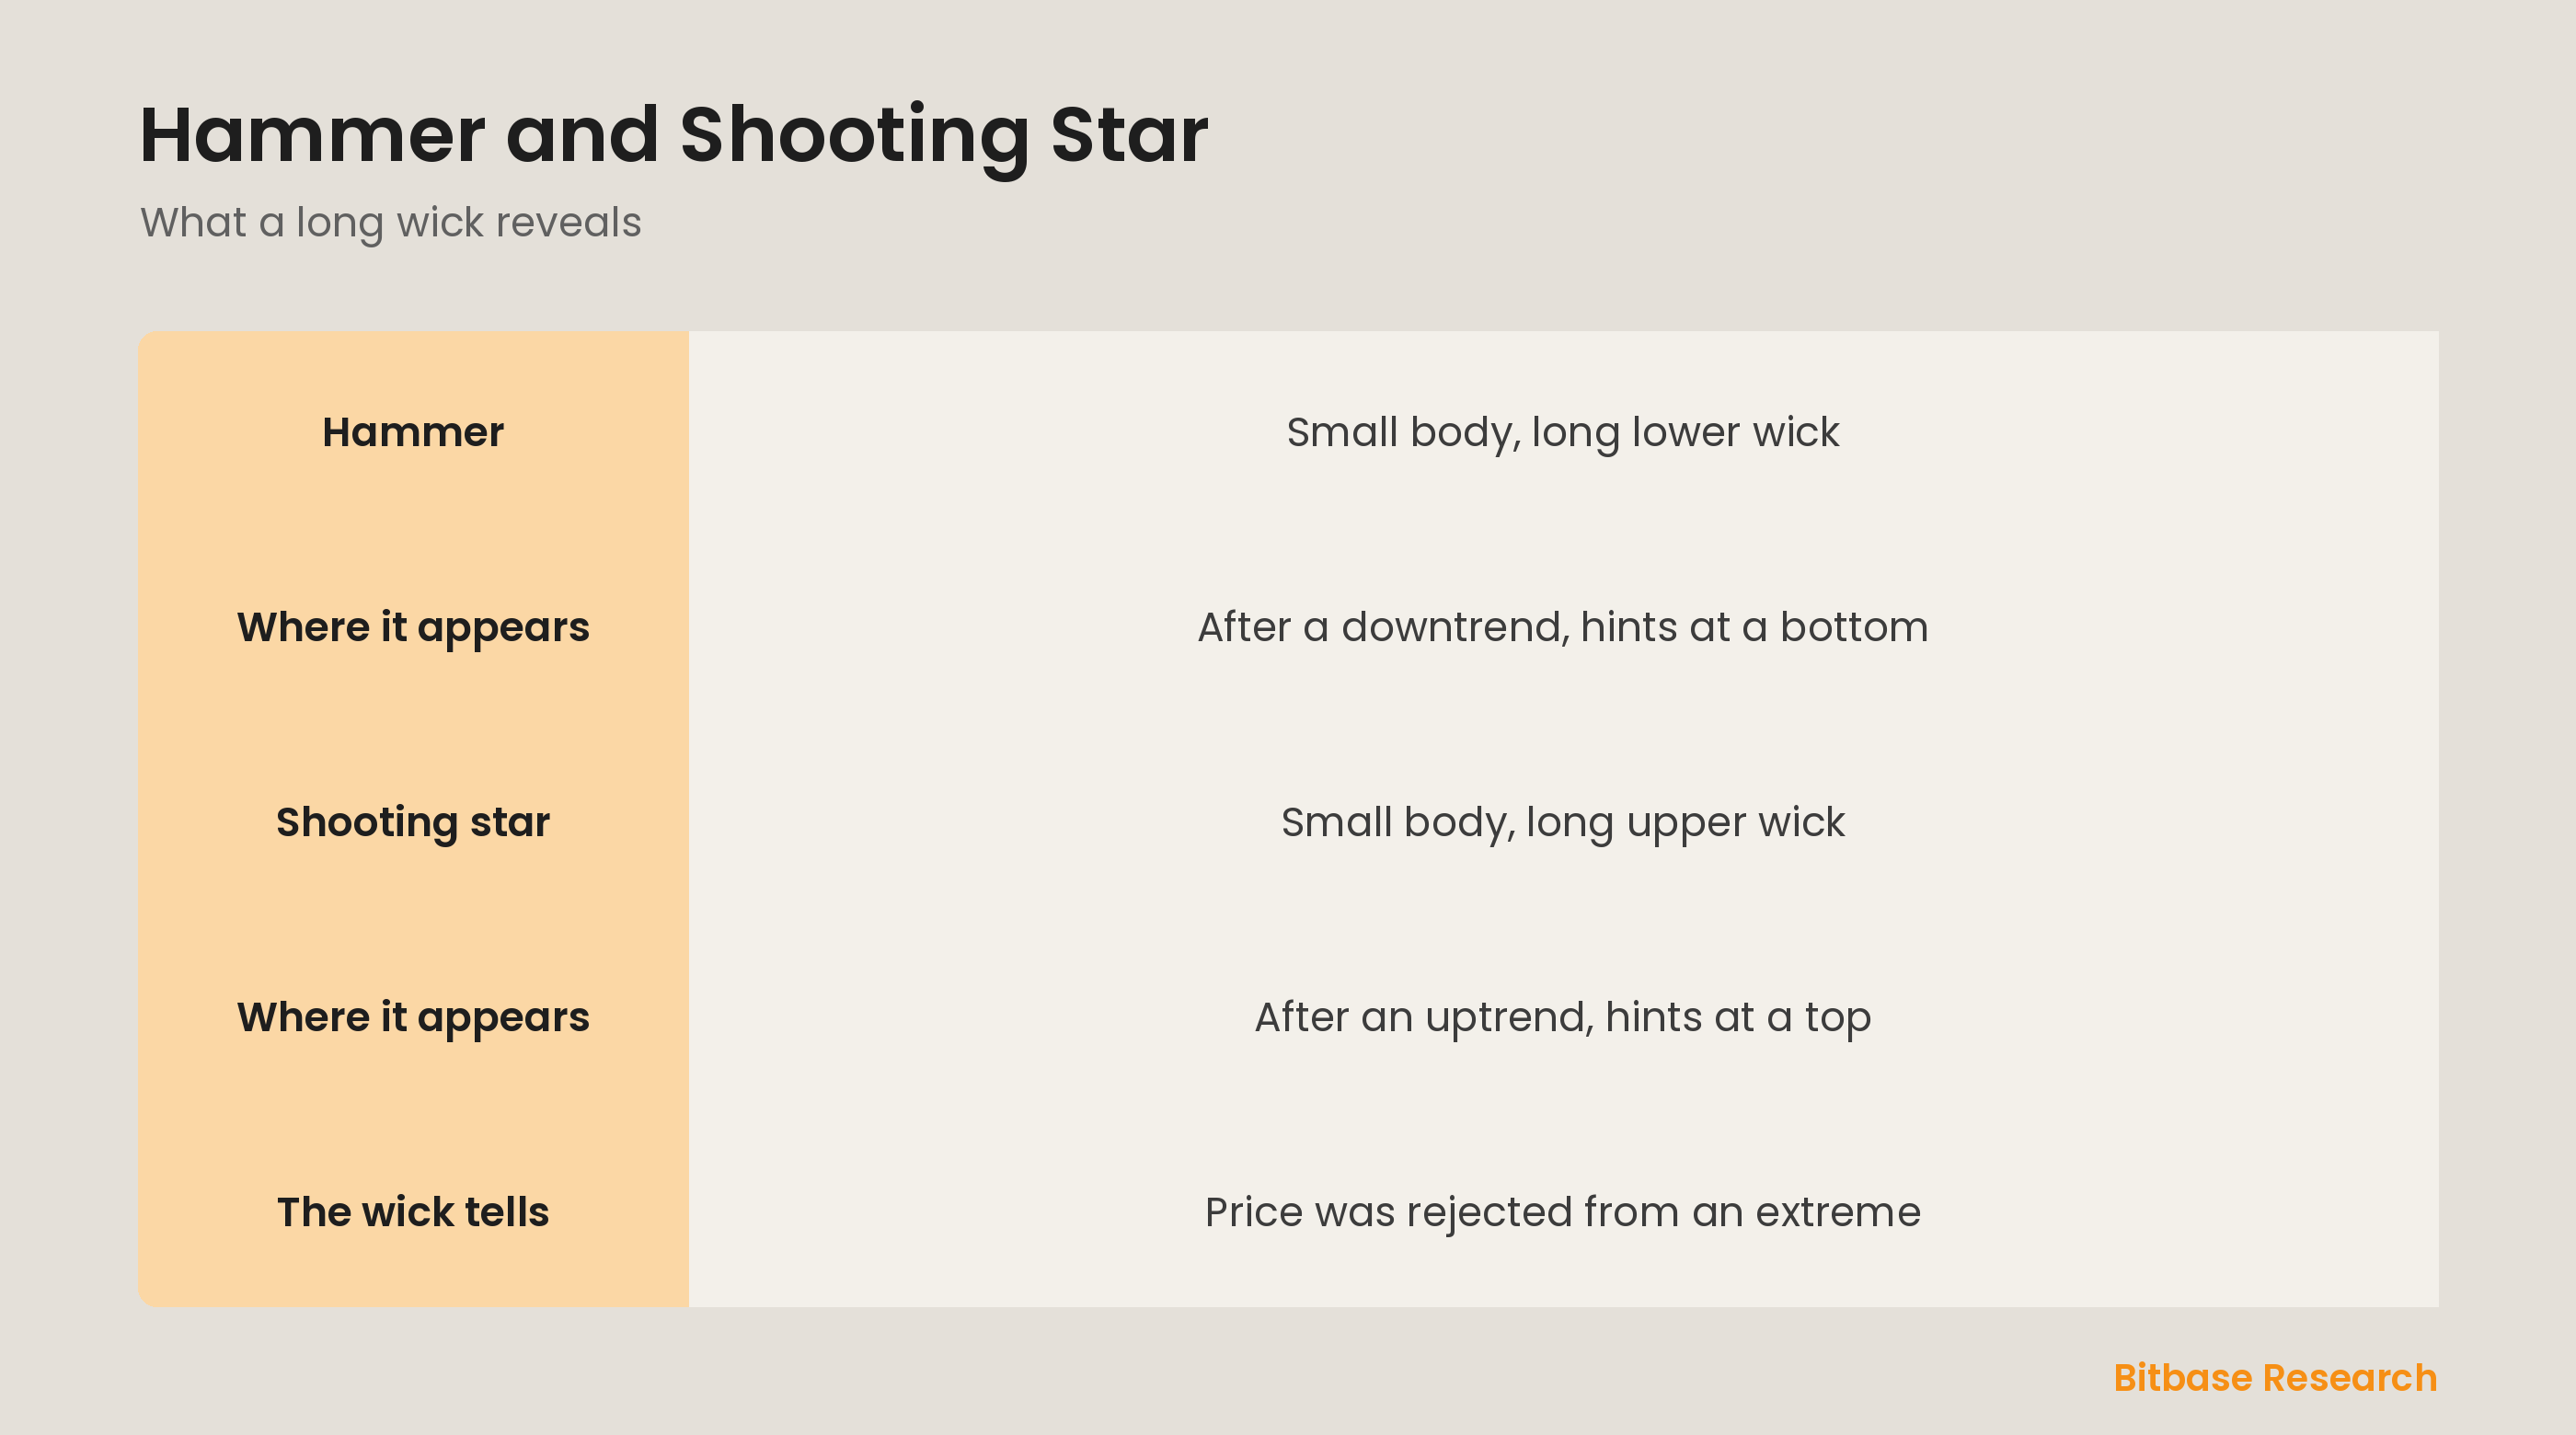
A hammer carries its message when it appears after a downtrend. There, the long lower wick shows that despite continued selling, buyers defended a lower level and pushed price back up by the close. That rejection of lower prices hints the downtrend may be losing steam and a bottom could be forming. The same shape in the middle of nowhere is just a candle; it is the location after a decline that gives the hammer its meaning.
What a shooting star is
A shooting star is the upside-down version: a small body near the bottom and a long upper wick. The long upper wick means price rose sharply during the period but was then sold back down, closing near where it opened. That shows buyers tried to push higher and failed, with sellers stepping in to reject the highs. It is a sign of selling pressure emerging from above, capping the advance.
Where a shooting star matters
A shooting star carries its message when it appears after an uptrend. There, the long upper wick shows that despite continued buying, sellers defended a higher level and pushed price back down by the close. That rejection of higher prices hints the uptrend may be stalling and a top could be forming. As with the hammer, context is everything: the shape only signals a possible reversal at the end of a clear move.
The bottom line
A hammer is a candle with a small body and a long lower wick, showing price was pushed down then rejected, and after a downtrend it hints at a bottom. A shooting star is its mirror, a small body with a long upper wick, showing price was pushed up then rejected, and after an uptrend it hints at a top. In both, the long wick is the story: price reached an extreme and got shoved back, but only the right context makes it a signal. To keep learning the fundamentals, follow more from Bitbase Academy.
Disclaimer: This article is educational content from Bitbase Academy, provided for information only. It does not constitute investment, trading, tax, or financial advice. Crypto assets are volatile; assess your own risk. Written as of June 2026; refer to the latest official information.
References
[1] Investopedia, "Hammer Candlestick: What It Is and How Investors Use It" investopedia.com
[2] Investopedia, "Shooting Star: What It Means in Stock Trading, With Example" investopedia.com
[3] Investopedia, "Candlestick: What It Is, What It Tells Investors" investopedia.com