




Author: Marc Arjoon, CFA (@marcarjoon)
Compiled by: Shenchao TechFlow
Shenchao Introduction:The crypto industry has long debated the valuation anchors of public blockchains: is it protocol fee revenue (REV), the number of active addresses, DEX trading volume, or the law of network effects that can explain the market capitalization performance of public blockchains? Chartered Financial Analyst (CFA) Marc Arjoon provides a detailed data test through time-series regression analysis of mainstream Layer 1 assets over several years.
Empirical research shows that in the short term, the price fluctuations of all mainstream Layer 1s are still dominated by Bitcoin's Beta coefficient. In terms of long-term valuation, Ethereum has completely decoupled from its own protocol revenue, and on-chain valuation shows characteristics highly correlated with total value locked (TVL) and stablecoin supply, reflecting that the market currently tends to view public blockchain tokens as monetary assets competing for liquidity, rather than traditional cash-flow-discounting enterprises.

Short-Term Pricing Mechanism: Layer 1 Tokens Are Essentially Dominated by Bitcoin's Beta Coefficient
The brief conclusion is: within any investment horizon that traders care about, the trading performance of Layer 1 tokens is essentially determined by Bitcoin's Beta coefficient.
I ran a regression analysis of monthly logarithmic changes in the market capitalization of each Layer 1 against Bitcoin, and then added four on-chain time-series data: real protocol revenue denominated in native tokens (REV), active addresses, DEX trading volume, and stablecoin supply.
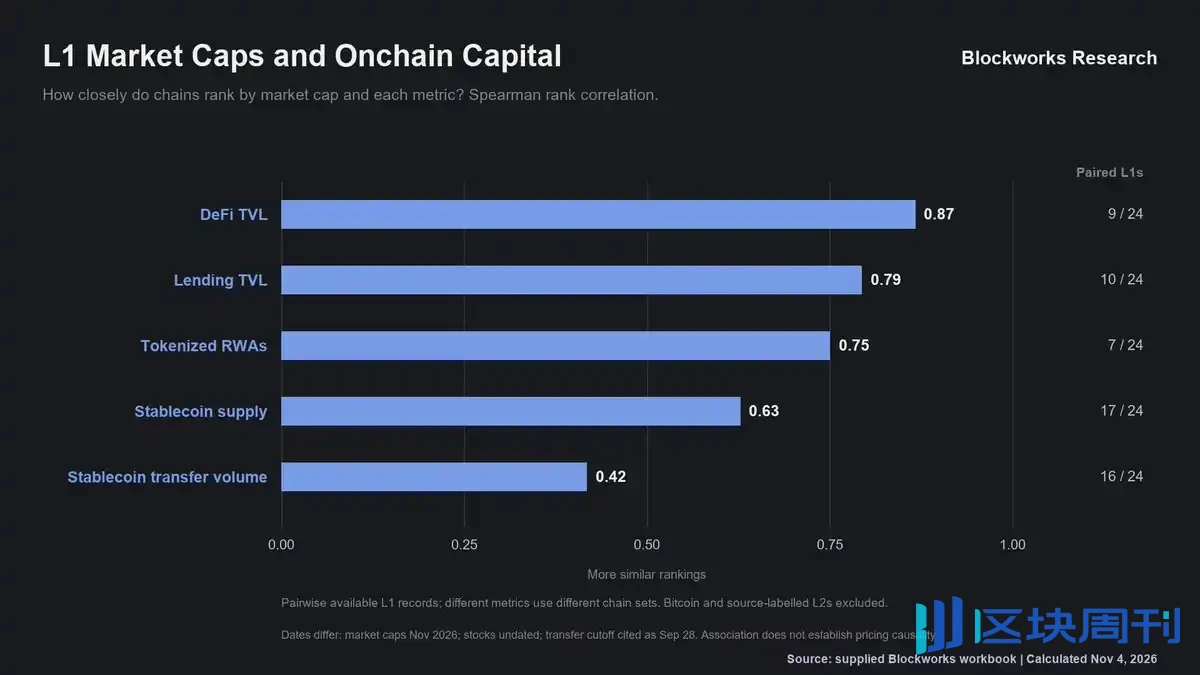
Chart: Regression analysis of changes in L1 market capitalization versus Bitcoin and on-chain metrics
The Illusion of USD Denomination: The Disconnect Between Native Tokens and Real Protocol Revenue
Looking deeper, USD-denominated metrics often tend to beautify fundamentals. This is because when token prices rise, fees paid in native tokens appear larger in USD terms, and total value locked (TVL) is to a large extent merely the result of native tokens calculated at market capitalization.
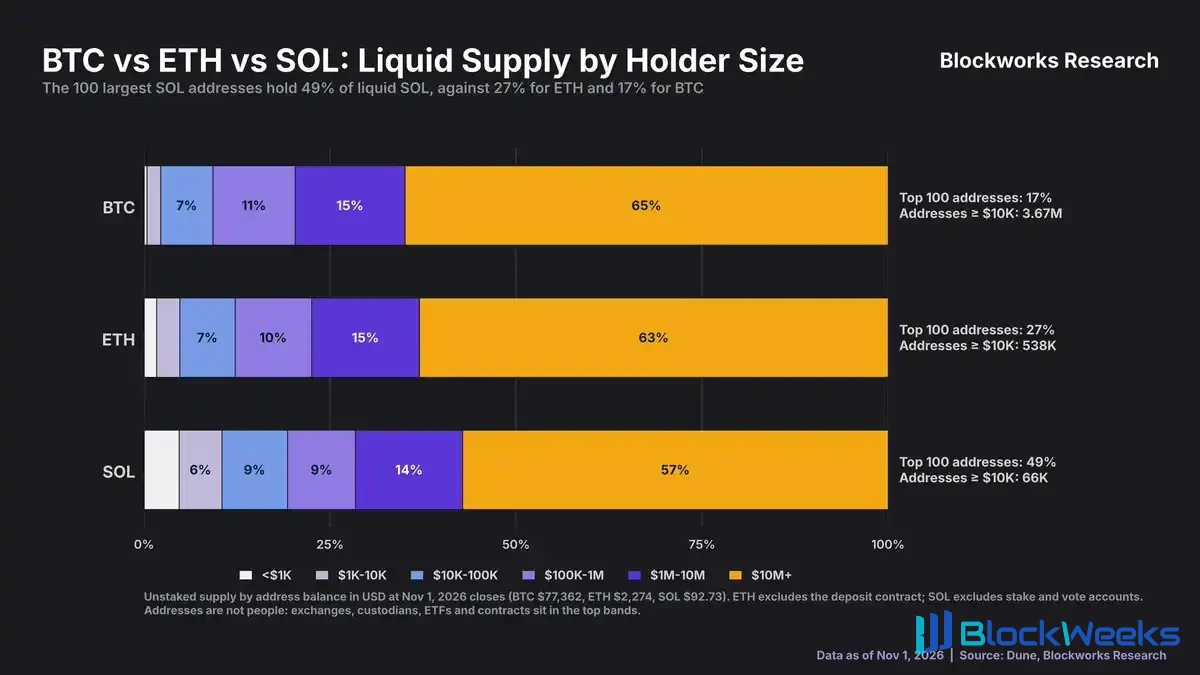
Chart: Comparison of real protocol revenue under native-token denomination and USD denomination
Ethereum's Revenue Decoupling: Policy Design, Not a Demand Collapse
Ethereum is the most obvious case of decoupling between real protocol revenue (REV) and network market capitalization.
In the week of the Dencun upgrade, Ethereum's cumulative real protocol revenue over the past 12 months was 100 million USD, and by August 2025 it had fallen to 100 million USD, a decline of 60%.
However, at the same time, its market capitalization rose against the trend, climbing from 100 million USD to 100 million USD. This is an active policy design choice, not a collapse in real demand. The introduction of Blob fees and the increase in the Gas limit were originally intended to lower the price of Layer 1 block space.
The rebound in Ethereum's price in 2025 mainly relied on spot ETFs and allocation demand from listed companies' treasuries.

Chart: The decoupling trend between Ethereum's protocol revenue and market capitalization over the past 12 months
Solana's Resonance Phenomenon: Protocol Revenue and Market Capitalization Move in Sync
Solana is a typical representative of the two curves of protocol revenue and network market capitalization fluctuating in sync.
Since January 2023, Solana's protocol revenue over the past 12 months and its market capitalization have both grown by about 15 times, and peaked in the same week, at 100 million USD and 100 million USD respectively.
Since then, both metrics have declined in sync, and are now down to 100 million USD and 100 million USD respectively.

Chart: The synchronized trend of Solana's protocol revenue and market capitalization over the past 12 months
Active Addresses and Trading Volume: Weak Correlation and Cyclical Divergence
I then looked at active addresses and decentralized exchange (DEX) trading volume. Over a full cycle, active addresses and market capitalization show a co-drifting trend, and this phenomenon is clearest on Solana and TRON.
However, at the weekly level, this correlation weakens significantly, and there are huge divergences.
Since January 2022, the number of active addresses on Ethereum has grown by 26%, but its market capitalization has fallen by 34%; while the number of active addresses on Solana has grown 17-fold, but its market capitalization has risen by only 17%.

Chart: Comparison of cyclical trends between active addresses and market capitalization
DEX trading volume tracks market capitalization more closely than address counts, especially on Solana, where both metrics started from their 2023 lows and peaked together.
But it should be noted that DEX trading volume is denominated in US dollars, so part of the fit is contributed by the price fluctuations of the tokens themselves. As tokenized assets rise in share of trading volume, we can further test whether this relationship still holds.

Chart: Tracking trend of DEX trading volume and market capitalization
Testing Metcalfe's Law: Network Value Is Close to the Square Root of Address Count
Metcalfe's law provides a classic model for evaluating these Layer 1s. The law states that network value is proportional to the square of the number of users (exponent of 2).

Chart: Network value fit under Metcalfe's Law
Fitting market capitalization against active addresses yields an elasticity exponent of 0.56 on Ethereum and 0.62 on Solana and BNB. Therefore, the actual value scales more closely with the square root of address count rather than the square.

Chart: Elasticity coefficient fit of market capitalization to active addresses
The core issue is that the growth rate of active addresses will gradually slow as the network develops, not just a question of the exponent's magnitude.
Since January 2016, Bitcoin's active addresses have grown only 1.3-fold, while its market capitalization has grown 252-fold. Ethereum has not departed from this pattern: since February 2018, its active addresses have grown 2.6-fold, its market capitalization has grown 4.5-fold, and changes in active addresses explained 84% of market capitalization changes. Solana's current cycle time is shorter, but overall it still follows a similar trajectory.

Chart: Long-term comparison of active address growth rate and market capitalization multiple
Testing Public Chain Valuation Multiples: Failure of Mean Reversion and Predictive Power of Revenue
I then tested six valuation multiples on these chains: the Metcalfe multiple, the Odlyzko multiple (users multiplied by natural logarithm), NVT based on stablecoin transfer volume, market capitalization to DEX trading volume, market capitalization to protocol revenue (Mcap/REV), and market capitalization to total stablecoin supply.
A practically usable valuation model requires its multiple to reliably mean-revert and to effectively predict future returns when in the undervalued range.
However, tests show that none of the multiples stably exhibits mean-reversion characteristics. Market capitalization to protocol revenue (Mcap/REV) is the only indicator that can predict positive returns over the next 13 weeks when at low valuation percentiles across multiple public chains (Ethereum and TRON).

Chart: Comparison of predictive performance of six common public chain valuation multiples
Differences in Holder Structure: Settled Capital and Long-Term Holding Base
Judging from holders' holding behavior, no Layer 1 has as deep a long-term holder base as Bitcoin.
Even including native staking, only 4% of Solana's supply and only 10% of Ethereum's supply have remained unmoved for more than three years, while Bitcoin's corresponding long-term unmoved proportion is as high as 42%.

Chart: Comparison of the share of token supply held for more than 3 years
At the same time, the top 100 non-staked Solana addresses by holdings control 49% of the circulating SOL, while the top 100 Ethereum addresses hold 27%, and Bitcoin 17%.
In terms of the number of addresses holding value of $10,000 or more, Solana has only about 66,000, while Ethereum has 538,000 and Bitcoin has 3.67 million (this may reflect more the differences in the total market capitalization of each asset).

Chart: Concentration of non-staked liquid tokens and distribution of large holder addresses
Ethereum's True Pricing Anchor: Peer Capital Scale Rather Than On-Chain Activity
Focusing on Ethereum, an interesting phenomenon is that its pricing mechanism operates relative to the capital scale of its competitors, rather than based on pure on-chain activity.
Among the comparison group of mainstream public blockchains, Ethereum accounts for 59% of total market capitalization share, 53% of stablecoin supply, 60% of stablecoin transfer volume, 70% of DeFi TVL, 75% of tokenized real-world assets (RWA), and 76% of lending protocol TVL.
By contrast, Ethereum's share of active addresses and on-chain transaction counts is much smaller, at only 5% and about 1%, respectively.

Chart: Comparison of Ethereum's share of capital accumulation versus activity share among peer public blockchains
Cross-Chain Correlation Test: Total Value Locked and Stablecoins Drive Market Cap Rankings
This pattern holds broadly across different public blockchains. When ranked by market capitalization, the rankings of various public blockchains closely match their rankings in total value locked (TVL) (Spearman rank correlation coefficient of 0.87), and also show a strong correlation with stablecoin supply rankings (0.63).
However, the correlation coefficient between market cap rankings and on-chain transaction counts is only 0.17, and with active address counts only 0.45, showing an extremely weak association.

Chart: Rank correlation analysis of market cap with TVL, stablecoin supply, and transaction activity
It is worth noting that in the current composition of TVL on Ethereum, ETH itself no longer accounts for the vast majority, which greatly reduces the autocorrelation of this metric and makes it more valuable as a reference.

Chart: Evolution of the asset composition of total value locked on Ethereum
Although this is only a cross-sectional ranking rather than a complete causal model, it aligns closely with the results of time-series regressions (even when run on a sample of more than 40 public blockchains).
Another notable difference lies in the structural composition of token holders. Spot ETFs and publicly listed corporate treasuries currently hold 11.9% of Ethereum's total supply, roughly on par with Bitcoin's 12.2%, and significantly higher than Solana's 7.9%.

Chart: Share of each token's supply held by spot ETFs and publicly listed company treasuries
Final Thoughts on Public Blockchain Valuation: Competing for the Monetary Asset Attribute of Capital Accumulation
The ultimate core insight is that the valuation drivers of Layer 1 depend to a lesser extent on how much on-chain interaction activity the network processes, and to a greater extent on how much capital it can attract and accumulate.
Bitcoin remains the dominant force driving short-term price fluctuations. At least for now, when the market prices Layer 1 assets, it views them less as businesses that profit from fee cash flows and more as monetary assets competing for capital accumulation and liquidity share.