

Last week we used Chan Theory to look at BTC's structure, and the market's movement was basically within expectations. This week, let's switch perspectives and look again using Elliott Wave Theory. The conclusion is actually clearer and more worthy of caution: This rebound that started in July may be nearing its end.
When the market is moving smoothly, the easiest thing to overlook is the question of "is this a rebound or a reversal?" This week we'll lay out the answer and also take a look at HYPE, which just made a new high and is currently pulling back, to see if this step it's taking is stable.
Summary of this week's core trading views:
• BTC daily-level trend structure analysis (see Part 1 for details)
• BTC this week's market forecast and medium- and short-term trading strategies (see Part 2 for details)
• HYPE daily-level trend structure analysis (see Part 3 for details)
• HYPE this week's market forecast and short-term trading strategies (see Part 4 for details)
I. Bitcoin Daily-Level Trend Structure Analysis
In the previous weekly review, this column introduced the Chan Theory analysis system to systematically deconstruct and forecast BTC's daily-level trend structure since the rebound from the July 1 low, especially since September: the price has been oscillating at high levels on the daily chart since September 3 and will simultaneously build a second upward center. From the actual movement, this center is still in the process of being built, and the overall market rhythm is basically consistent with the previous forecast direction.
This week we will switch to the Elliott Wave Theory analysis framework to deeply analyze the current daily-level trend structure.
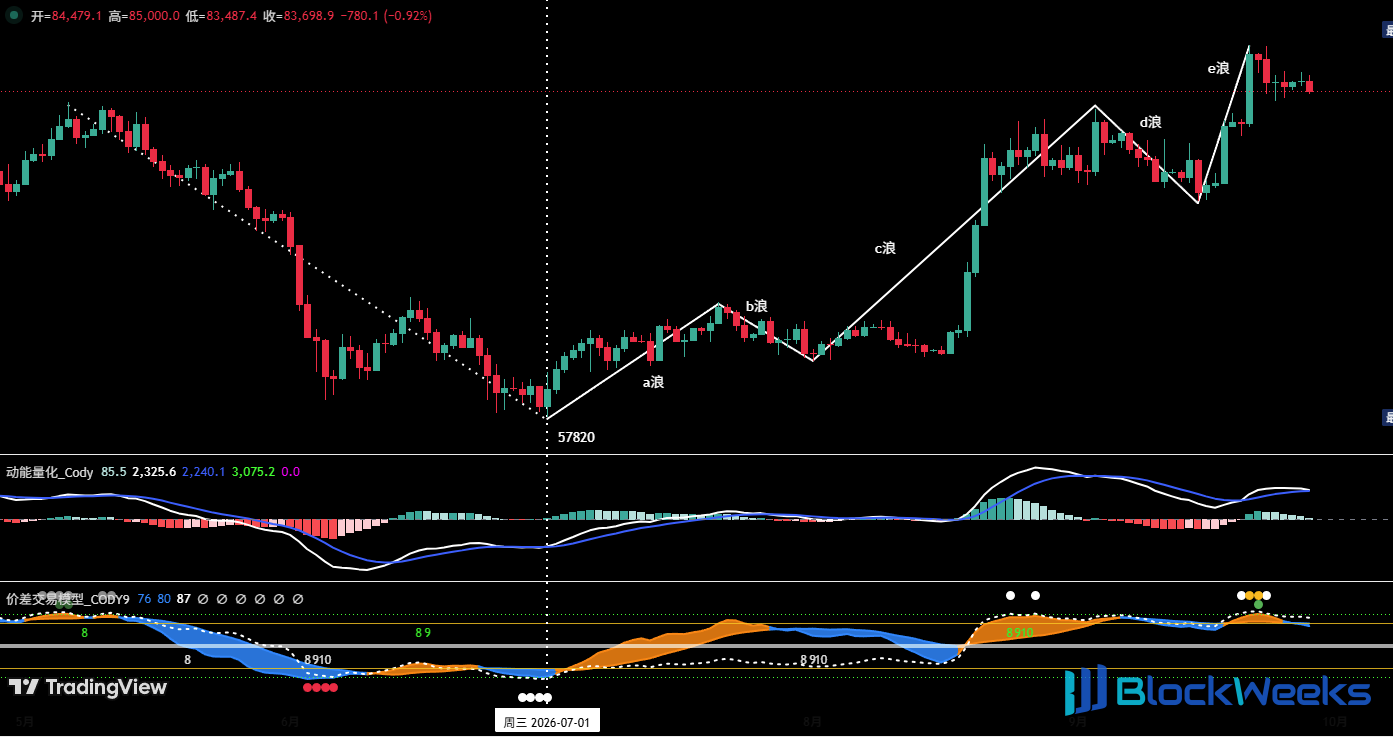
Figure 1 Bitcoin Daily K-Line Chart
1. Overall Structural Pattern
As shown in Figure 1, since the rebound from the July 1 low of $57,820, the price has initially formed a clear a→e five-wave upward structure. It is currently in the e-wave stage.
2. Five-Wave Structure Division
①. a-wave (rebound wave): July 1 to July 21
• Rebound range: $57,820 → $66,955
• Duration: 21 trading days
• Maximum gain in the range: 15.8%
②. b-wave (correction wave): July 21 to August 1
• Pullback range: $66,955 → $62,268
• Correction duration: 11 trading days
• Technical characteristics: The retracement precisely tested the 50% Fibonacci level of the a-wave gain
③. c-wave (rebound wave): August 1 to September 3
• Rebound range: $62,268 → $82,285
• Duration: 33 trading days
• Maximum gain in the range: 32.15%, close to 2.2 times the a-wave gain
④. d-wave (correction wave): September 3 to September 15
• Pullback range: $82,285 → $74,955
• Correction duration: 12 trading days
• Technical characteristics: The retracement was 37% of the c-wave gain, and the correction duration is basically symmetrical with the b-wave
⑤. e-wave (potential rebound wave): September 15 to present
• Starting point: $74,955
• Has been running for 12 trading days (ongoing)
• Current maximum gain in the range: 16.6%
3. In-Depth Analysis
①. After a short-term continuous rise, multiple technical indicators have entered a deeply overbought range.
②. As shown in Figure 1, the self-built "Momentum Quantitative Model" is currently in a top-level钝化 state (this signal is a necessary prerequisite for forming a top divergence); the "Spread Trading Model" has also continuously triggered top warning signals.
③. The price has approached the key resistance area of $88,000–$90,500.
④. Although the price has stood above the annual line (364-day moving average, about $80,500), it has not yet completed a pullback confirmation; and the current annual line direction is still downward.
⑤. If the subsequent rebound fails to refresh the September 21 high of $87,399, or effectively breaks below the $80,500–$82,500 support area, then it is confirmed that the e-wave rebound ended at $87,399.
⑤. In summary: The probability that the e-wave will end in this key resistance area is extremely high. The current market is still a daily-level oversold rebound, and a trend reversal has not yet been established.
II. Bitcoin This Week's Market Forecast and Trading Strategies
1. BTC This Week's Market Trend Forecast
Core view this week: BTC is at the end of the e-wave, focus on its termination point to confirm the completion of the five-wave structure.
2. Core Resistance Levels
• First resistance area: $88,000 area (previous important level)
• Second resistance area: $91,500–$93,000 area (previous important resistance area)
3. Core Support Levels
• First support level: around $82,500 (previous important support level)
• Second support level: $73,500–$75,000 area (previous important support level)
• Third support level: $67,300–$69,100 area (previous important support level)
4. This Week's Trading Strategies (Excluding the Impact of Sudden News)
①. Medium-term strategy:

Figure 2 Bitcoin _ Daily K-line chart: (Position Monitoring Model)
Position Monitoring Model: As shown in Figure 2, the coin price has broken through the "Long-Short Channel", but has not yet undergone a pullback confirmation phase. Therefore, the current medium-term strategy is mainly to stay in cash and observe.
②. Short-term strategy: Use 30% of position, set stop-loss points, and based on support and resistance levels, look for opportunities to trade "price differences". (Use 30-minute/60-minute as the operating cycle).
③. In short-term operations, in order to dynamically adapt to complex market evolution, we have prepared A/B operation plans in advance.
• Plan A: Effectively break down and go short along the trend.
• Entry: If the downward momentum continues after this week's opening. When the coin price effectively breaks below the 80,500–82,500 USD support area, a short position of about 30% can be established.
• Risk control: Set an initial stop-loss level.
• Exit: When the adjustment reaches near an important support level and combined with model signals, positions can be closed in batches to take profit.
• Plan B: Light short trial in strong resistance zone.
• Entry: If the coin price rises to the 88,000–90,500 USD area, shows a clear pressured pullback pattern, and the quantitative model simultaneously issues a top signal, a short position of about 30% can be established.
• Risk control: Set an initial stop-loss level.
• Exit: When the adjustment reaches near an important support level and combined with model signals, positions can be closed in batches to take profit.
III. HYPE Daily-Level Trend Structure Analysis

Figure 3 HYPE Daily K-line Chart
1. Market validation of HYPE's judgment last week
As shown in Figure 3, last week's weekly review clearly pointed out: if the upward segment (16-17) is confirmed to have ended, the market will shift into a high-level consolidation pattern. The actual market movement was basically consistent with last week's judgment.
2. Current trend analysis
①. On September 22, the price hit a historic high of 101.93 USD, confirming that the long-term bullish pattern remains unchanged and the upward trend continues;
②. The current trend can be defined as the pullback confirmation phase after breaking above the previous high of 89.69 USD. The support near this price level constitutes a short-term "watershed". If the support is effective, it will continue to fluctuate upward; otherwise, the adjustment cycle will be extended.
③. If the price effectively breaks below the key support near 89.69 USD, there is a possibility of further probing downward to support near 85 USD, or even seeking support near 77 USD again.
IV. HYPE This Week's Market Forecast and Short-Term Trading Strategy
1. HYPE This Week's Market Trend Forecast
①. Core resistance levels:
• First resistance level: near 102 USD
• Second resistance level: near 110 USD
②. Core support levels:
• First support level: near 90 USD
• Second support level: 84–85 USD area
• Third support level: 76–77 USD area
③. This week's core view:
Focus on the final direction of the long-short battle near the key support level of 90 USD. Combined with the judgment of our self-built quantitative model indicators, the probability of the price continuing a high-level consolidation pattern is relatively high.
2. HYPE This Week's Short-Term Trading Strategy
①. If it stabilizes at a key support level, try a light long position.
If the price falls back to near the 89.69 USD support level and shows a stabilizing pattern, and the quantitative model simultaneously issues a bottom confirmation signal, long positions within 30% can be established in batches. Be sure to set a stop-loss and execute it strictly.
②. If it stabilizes in the secondary support range, try a light long position.
If the 89.69 USD support is lost. Wait for the price to continue adjusting to the 77–85 USD area and show a stabilizing signal, and the quantitative model simultaneously issues a bottom confirmation signal, then long positions within 30% can be established. Be sure to set a stop-loss and execute it strictly.
V. Special Reminder
1. When opening a position: immediately set an initial stop-loss level.
2. When profit reaches 1%: move the stop-loss to the opening cost price (break-even point) to ensure principal safety.
3. When profit reaches 2%: move the stop-loss to the position of 1% profit.
4. Continuous tracking: thereafter, for every additional 1% profit in the coin price, move the stop-loss by 1% simultaneously, dynamically protecting and locking in gains.
Financial markets change rapidly, and all market analysis and trading strategies need dynamic adjustment. All views, analytical models, and operational strategies involved in this article originate from personal technical analysis and are solely for personal trading log purposes, and do not constitute any investment advice or operational basis. Markets carry risks, investment requires caution, please do not make decisions based on this.