The stochastic oscillator is built on a clever observation: in an uptrend, prices tend to close near the top of their recent range, and in a downtrend, near the bottom. By measuring exactly where the latest close sits within the recent high-low range, the stochastic turns that idea into a momentum reading between 0 and 100. Here is how the stochastic oscillator works, what its two lines mean, and how traders read it.
The core idea
The stochastic oscillator asks a simple question: where did price close relative to its range over a recent period? If the close is near the top of the range, the reading is high, near 100; if near the bottom, the reading is low, near 0. The logic is that strong upward momentum pushes closes toward the highs, while weakness drags them toward the lows. So the stochastic captures momentum by locating the close within the recent swing.
Percent K and percent D
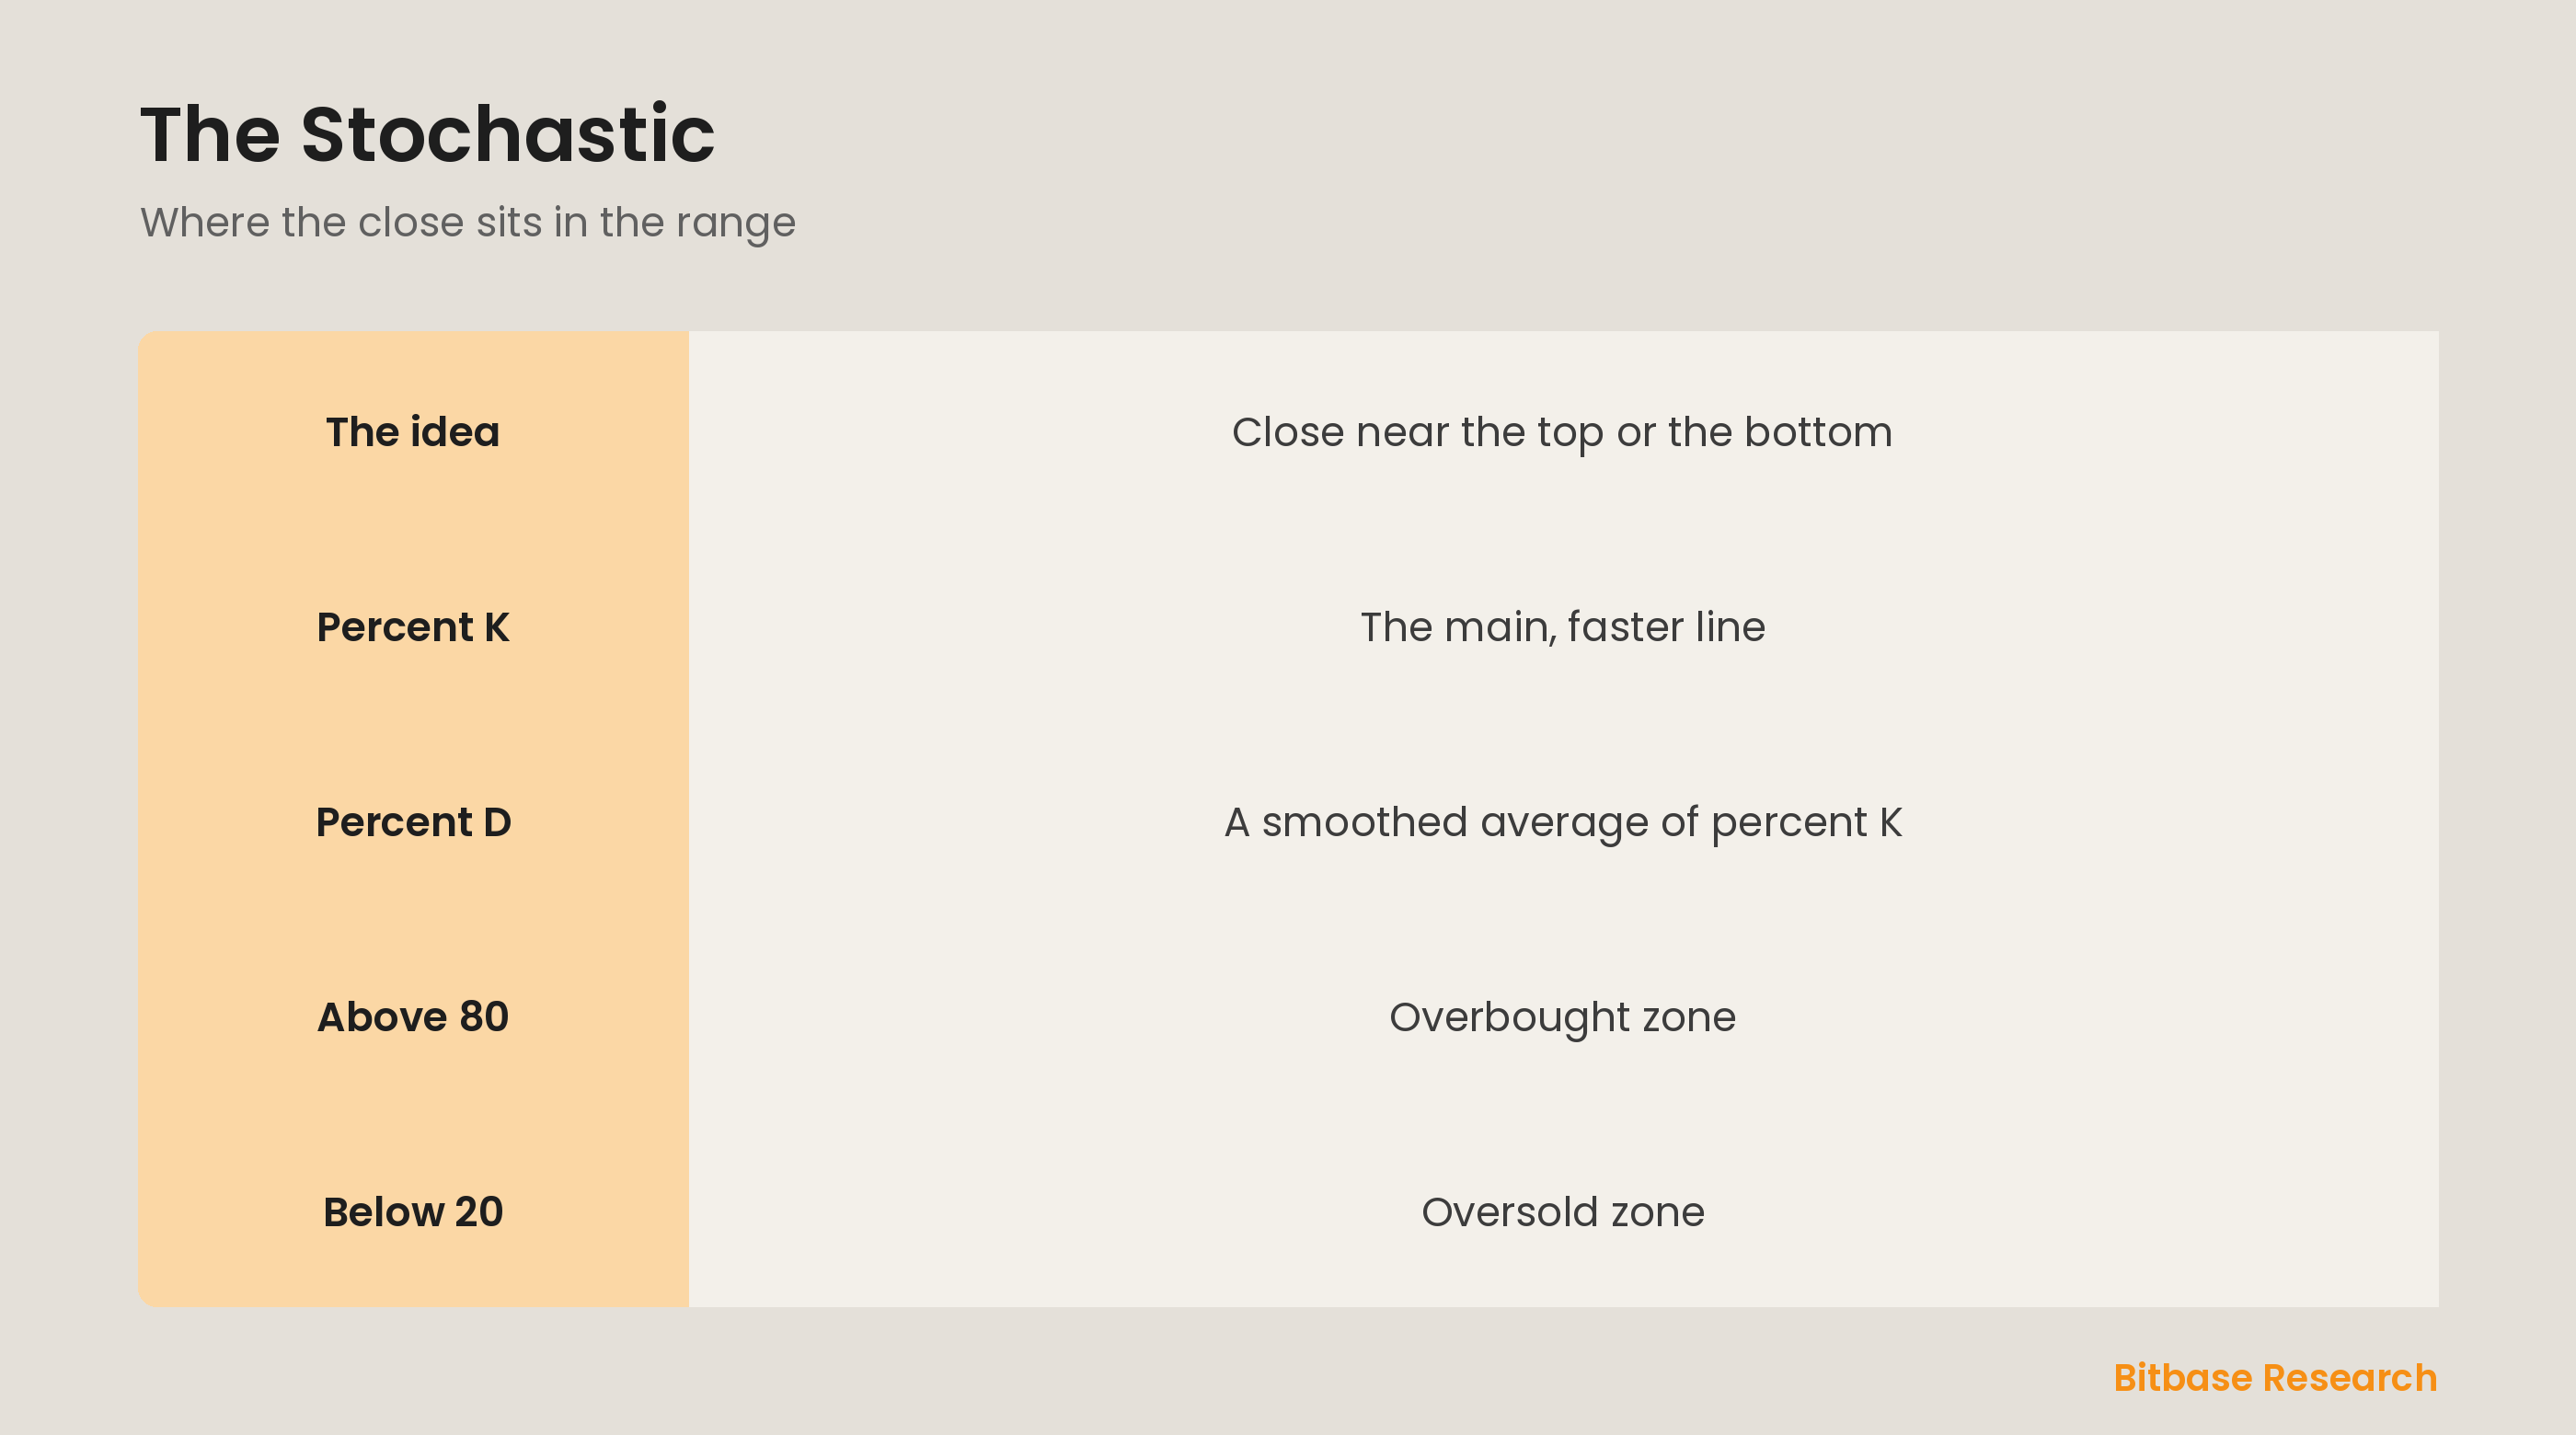
The stochastic has two lines. Percent K is the main line, the raw calculation of where the close sits in the range, and it moves faster. Percent D is a smoothed moving average of percent K, so it is slower and less jumpy, acting as a signal line. Watching the two together is central to using the stochastic: percent K reacts first, and percent D confirms, much like the fast and slow lines in other momentum tools.
Overbought and oversold zones
Like the RSI, the stochastic has zones, but at 80 and 20. A reading above 80 is considered overbought, meaning closes are pressing near the top of the range and the up move may be stretched. A reading below 20 is oversold, with closes near the bottom. As always, in a strong trend the stochastic can sit in a zone for a while without reversing, so these zones flag stretched conditions rather than guaranteed turns.
Crossovers and divergence
The stochastic gives two common signals. A crossover happens when percent K crosses percent D: K crossing above D, especially in the oversold zone, is a potential bullish signal, and K crossing below D in the overbought zone is a potential bearish one. Divergence works as it does elsewhere: if price makes a new high but the stochastic does not, momentum is fading. Both signals are best confirmed by the trend rather than traded blindly.
The bottom line
The stochastic oscillator measures where the close sits within the recent high-low range, on a 0 to 100 scale, capturing momentum from the idea that strength closes near the highs and weakness near the lows. Percent K is the fast line and percent D its smoothed signal line. Readings above 80 are overbought and below 20 oversold, while crossovers of the two lines and divergence from price are its main signals, best used with the trend for confirmation. To keep learning the fundamentals, follow more from Bitbase Academy.
Disclaimer: This article is educational content from Bitbase Academy, provided for information only. It does not constitute investment, trading, tax, or financial advice. Crypto assets are volatile; assess your own risk. Written as of June 2026; refer to the latest official information.
References
[1] Investopedia, "Stochastic Oscillator: What It Is, How It Works, How To Calculate" investopedia.com
[2] Investopedia, "Relative Strength Index (RSI) Indicator Explained" investopedia.com
[3] Investopedia, "Technical Analysis: What It Is and How to Use It" investopedia.com