
Volume tells you how much traded, but on-balance volume, or OBV, goes a step further by tracking whether that volume is flowing into or out of an asset over time. It turns raw volume into a running line that reveals accumulation and distribution, the quiet buying or selling that can precede a price move. Here is how OBV is built, what its direction reveals, and why divergence between OBV and price is a signal worth watching.
The idea behind OBV
On-balance volume is a running total that adds or subtracts each period's volume based on whether price closed up or down. On a day price closes higher, that day's entire volume is added; on a day it closes lower, the volume is subtracted. The result is a single cumulative line. The idea is that volume on up days reflects buying pressure and volume on down days reflects selling pressure, so the running total tracks the net flow over time.
Reading the OBV line
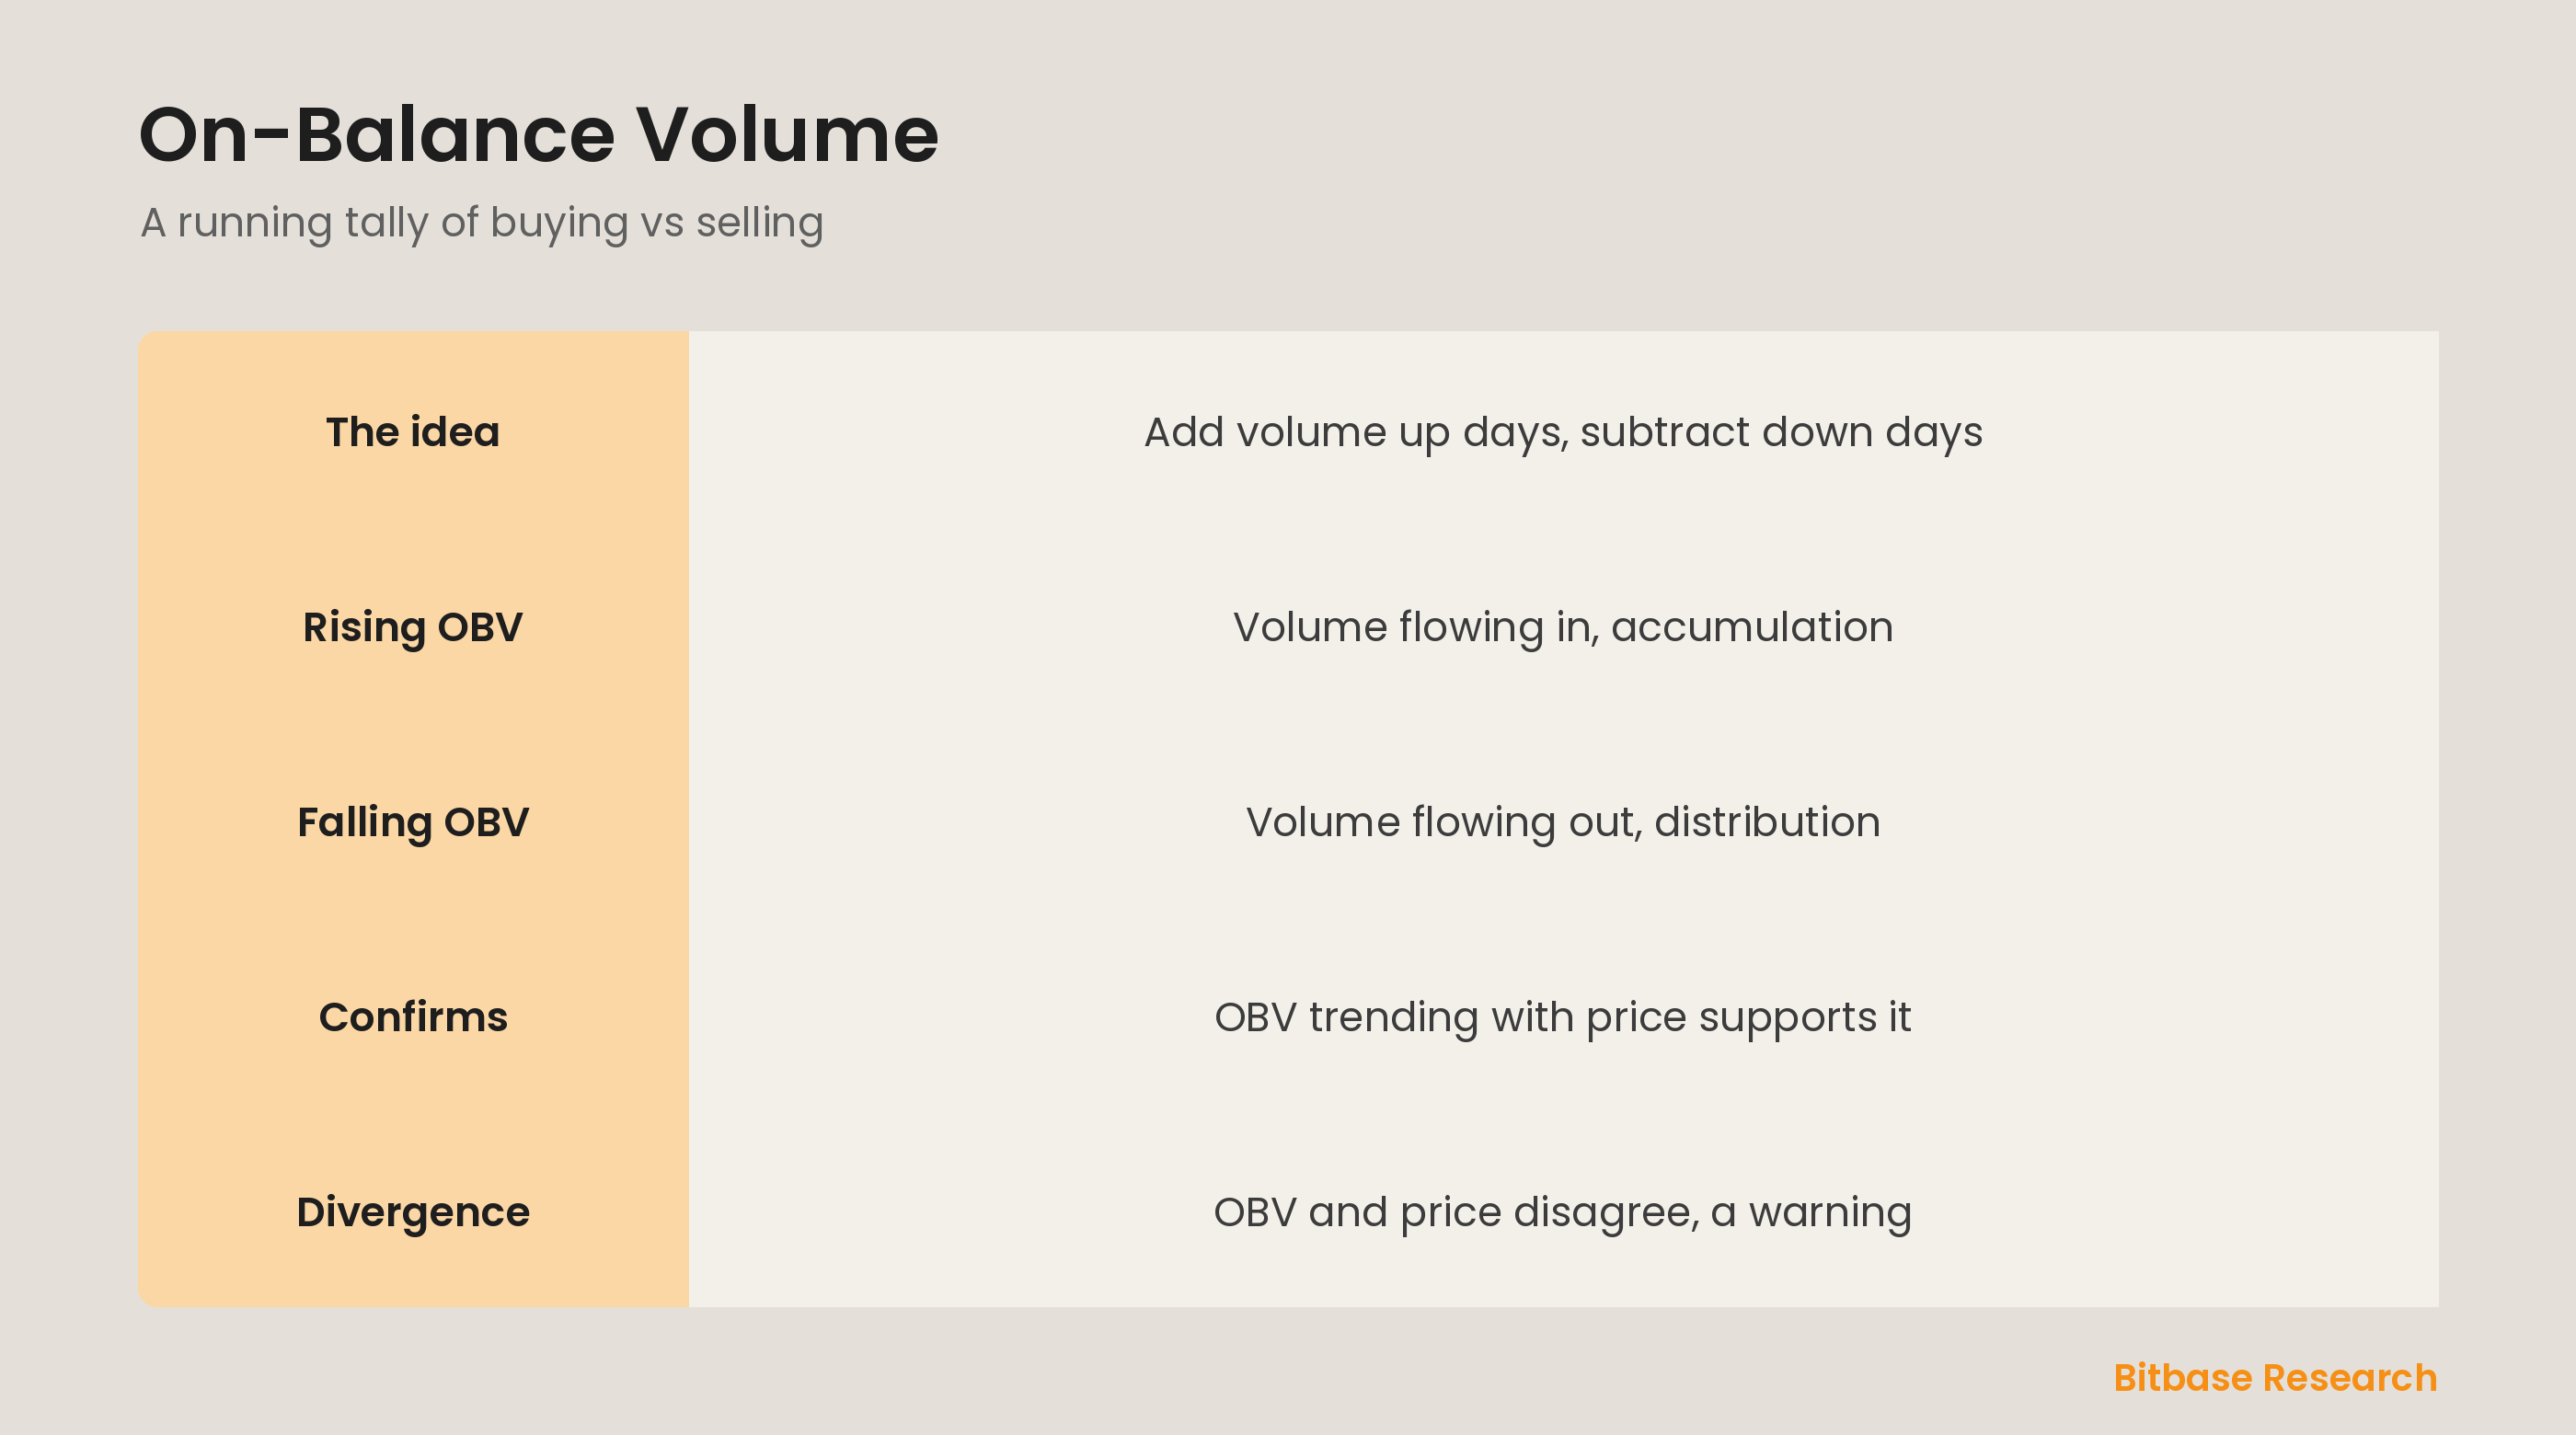
What matters about OBV is its direction, not its exact value. A rising OBV line means up-day volume is outweighing down-day volume, suggesting money is flowing into the asset, accumulation. A falling OBV line means down-day volume dominates, suggesting money is flowing out, distribution. By smoothing the buying and selling flow into one trending line, OBV lets you see whether pressure is building on the buy side or the sell side beneath the price.
OBV confirming price
When OBV moves in the same direction as price, it confirms the move. If price is rising and OBV is rising too, the uptrend is backed by genuine buying volume, which strengthens it. If price is falling and OBV is falling, the downtrend has real selling behind it. This agreement between price and OBV is reassuring: it means the volume flow supports what price is doing, giving the trend more credibility.
OBV divergence
The most valued OBV signal is divergence, when it disagrees with price. If price makes a new high but OBV does not, buying volume is not confirming the advance, hinting the rally is weaker than it looks, a bearish divergence. If price makes a new low but OBV holds up, selling volume is fading, a bullish divergence. Because volume often shifts before price, OBV divergence can give an early warning that a trend is losing its underlying support.
The bottom line
On-balance volume keeps a running total, adding volume on up days and subtracting it on down days, to track whether money is flowing into an asset, accumulation, or out of it, distribution. A rising OBV confirms an uptrend and a falling OBV a downtrend when they move with price. The most valued signal is divergence, when OBV and price disagree, which can warn early that a trend is losing the volume support beneath it. To keep learning the fundamentals, follow more from Bitbase Academy.
Disclaimer: This article is educational content from Bitbase Academy, provided for information only. It does not constitute investment, trading, tax, or financial advice. Crypto assets are volatile; assess your own risk. Written as of June 2026; refer to the latest official information.
References
[1] Investopedia, "On-Balance Volume (OBV): Definition, Formula, and Uses" investopedia.com
[2] Investopedia, "Volume: Definition in Trading and How To Use It" investopedia.com
[3] Investopedia, "Accumulation/Distribution Indicator (A/D): Definition and Uses" investopedia.com