Price on its own jumps around so much that the underlying direction can be hard to see. A moving average is the classic tool for cutting through that noise, drawing a smooth line that follows the trend instead of every wiggle. It is probably the single most widely used indicator in trading, and once you understand it, a lot of other tools start to make sense. Here is what a moving average is and how traders use it.
What a moving average is
A moving average is simply the average price over a set number of recent periods, recalculated with each new candle so the line moves along with price. If you take the average closing price of the last twenty candles, then the last twenty again on the next candle, and so on, you get a smooth line. Because each point blends many prices, the jagged noise cancels out and the line reveals the general direction more clearly than raw price.
Why smoothing helps
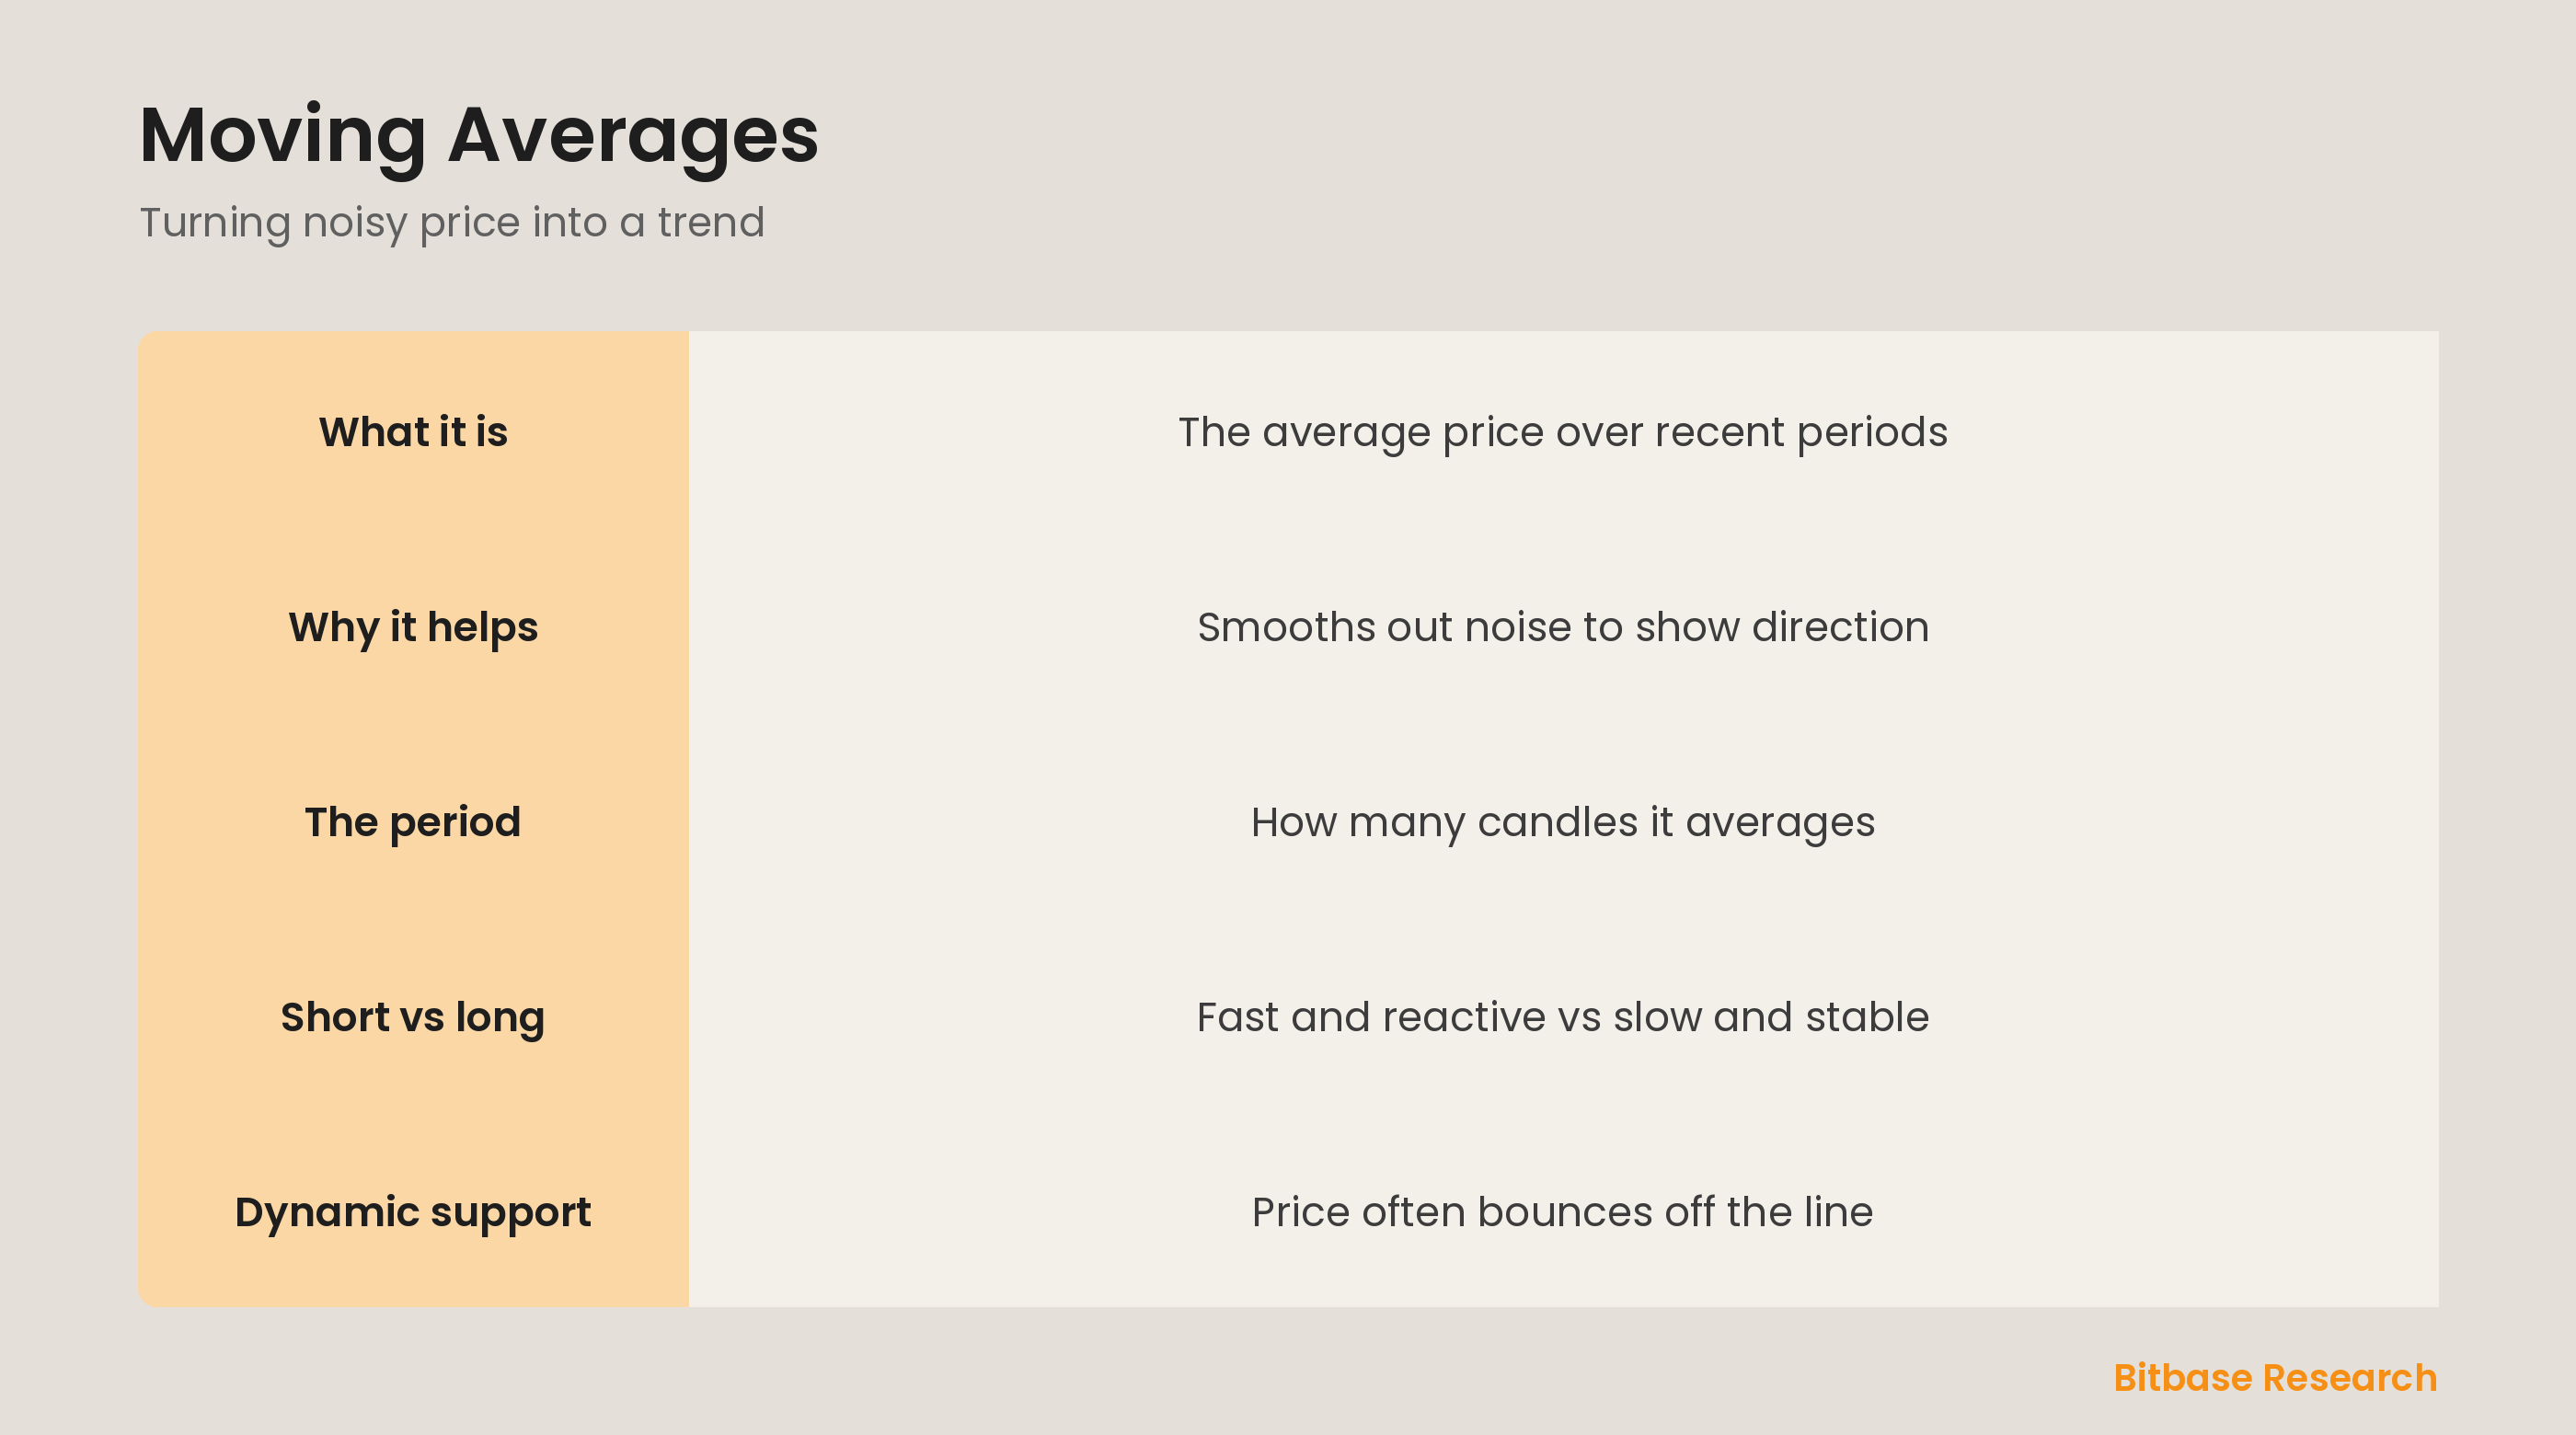
Raw price is full of small, random moves that make the real trend hard to judge. By averaging, a moving average filters out much of that short-term noise, leaving a cleaner picture of where price is generally heading. When the line slopes up, the trend is broadly up; when it slopes down, broadly down; when it is flat, the market is ranging. That simple read on direction is why the moving average is a foundation of technical analysis.
Choosing the period
The period is how many candles the average covers, and it controls the trade-off between speed and smoothness. A short period, like 10, hugs price closely and reacts quickly, but it also picks up more noise and gives more false signals. A long period, like 200, is slow and smooth, showing the major trend but lagging behind turns. Traders pick a period to match their horizon: short for fast trading, long for the big picture.
Moving averages as dynamic support
Beyond showing direction, moving averages often act as dynamic support and resistance. In an uptrend, price frequently pulls back to a rising moving average and bounces off it, as if the line were a moving floor. In a downtrend, price rallies up to a falling average and turns down from it, like a moving ceiling. Because the line moves with price, it is called dynamic, and many traders watch these bounces for entries.
The bottom line
A moving average is the average price over a set number of recent periods, redrawn each candle to form a smooth line that follows the trend. By averaging away short-term noise, it makes the general direction easy to see: up, down, or flat. A shorter period reacts faster but is noisier; a longer one is smoother but slower. Beyond direction, the line often acts as dynamic support or resistance, which is why it anchors so many trading tools. To keep learning the fundamentals, follow more from Bitbase Academy.
Disclaimer: This article is educational content from Bitbase Academy, provided for information only. It does not constitute investment, trading, tax, or financial advice. Crypto assets are volatile; assess your own risk. Written as of June 2026; refer to the latest official information.
References
[1] Investopedia, "Moving Average (MA): Purpose, Uses, Formula, and Examples" investopedia.com
[2] Investopedia, "Technical Analysis: What It Is and How to Use It" investopedia.com
[3] Investopedia, "Trend: Definition, Types, Examples, and Uses in Trading" investopedia.com