
Volume indicators become even more powerful when they combine price and volume to estimate how money is flowing into or out of an asset. Two popular tools do exactly this: the Money Flow Index and the Chaikin Oscillator. Both blend price and volume, but each in its own way and with its own scale. Here is what the MFI and Chaikin Oscillator measure, how to read their levels, and why divergence in each matters.
The Money Flow Index
The Money Flow Index, or MFI, is often described as a volume-weighted RSI. Like the RSI, it produces a reading from 0 to 100 that measures momentum, but it factors in volume as well as price, so it reflects the force of money moving in and out, not just price change. A rising MFI means buying pressure with volume behind it; a falling MFI means selling pressure. It combines the familiar RSI logic with the conviction that volume adds.
Reading the MFI
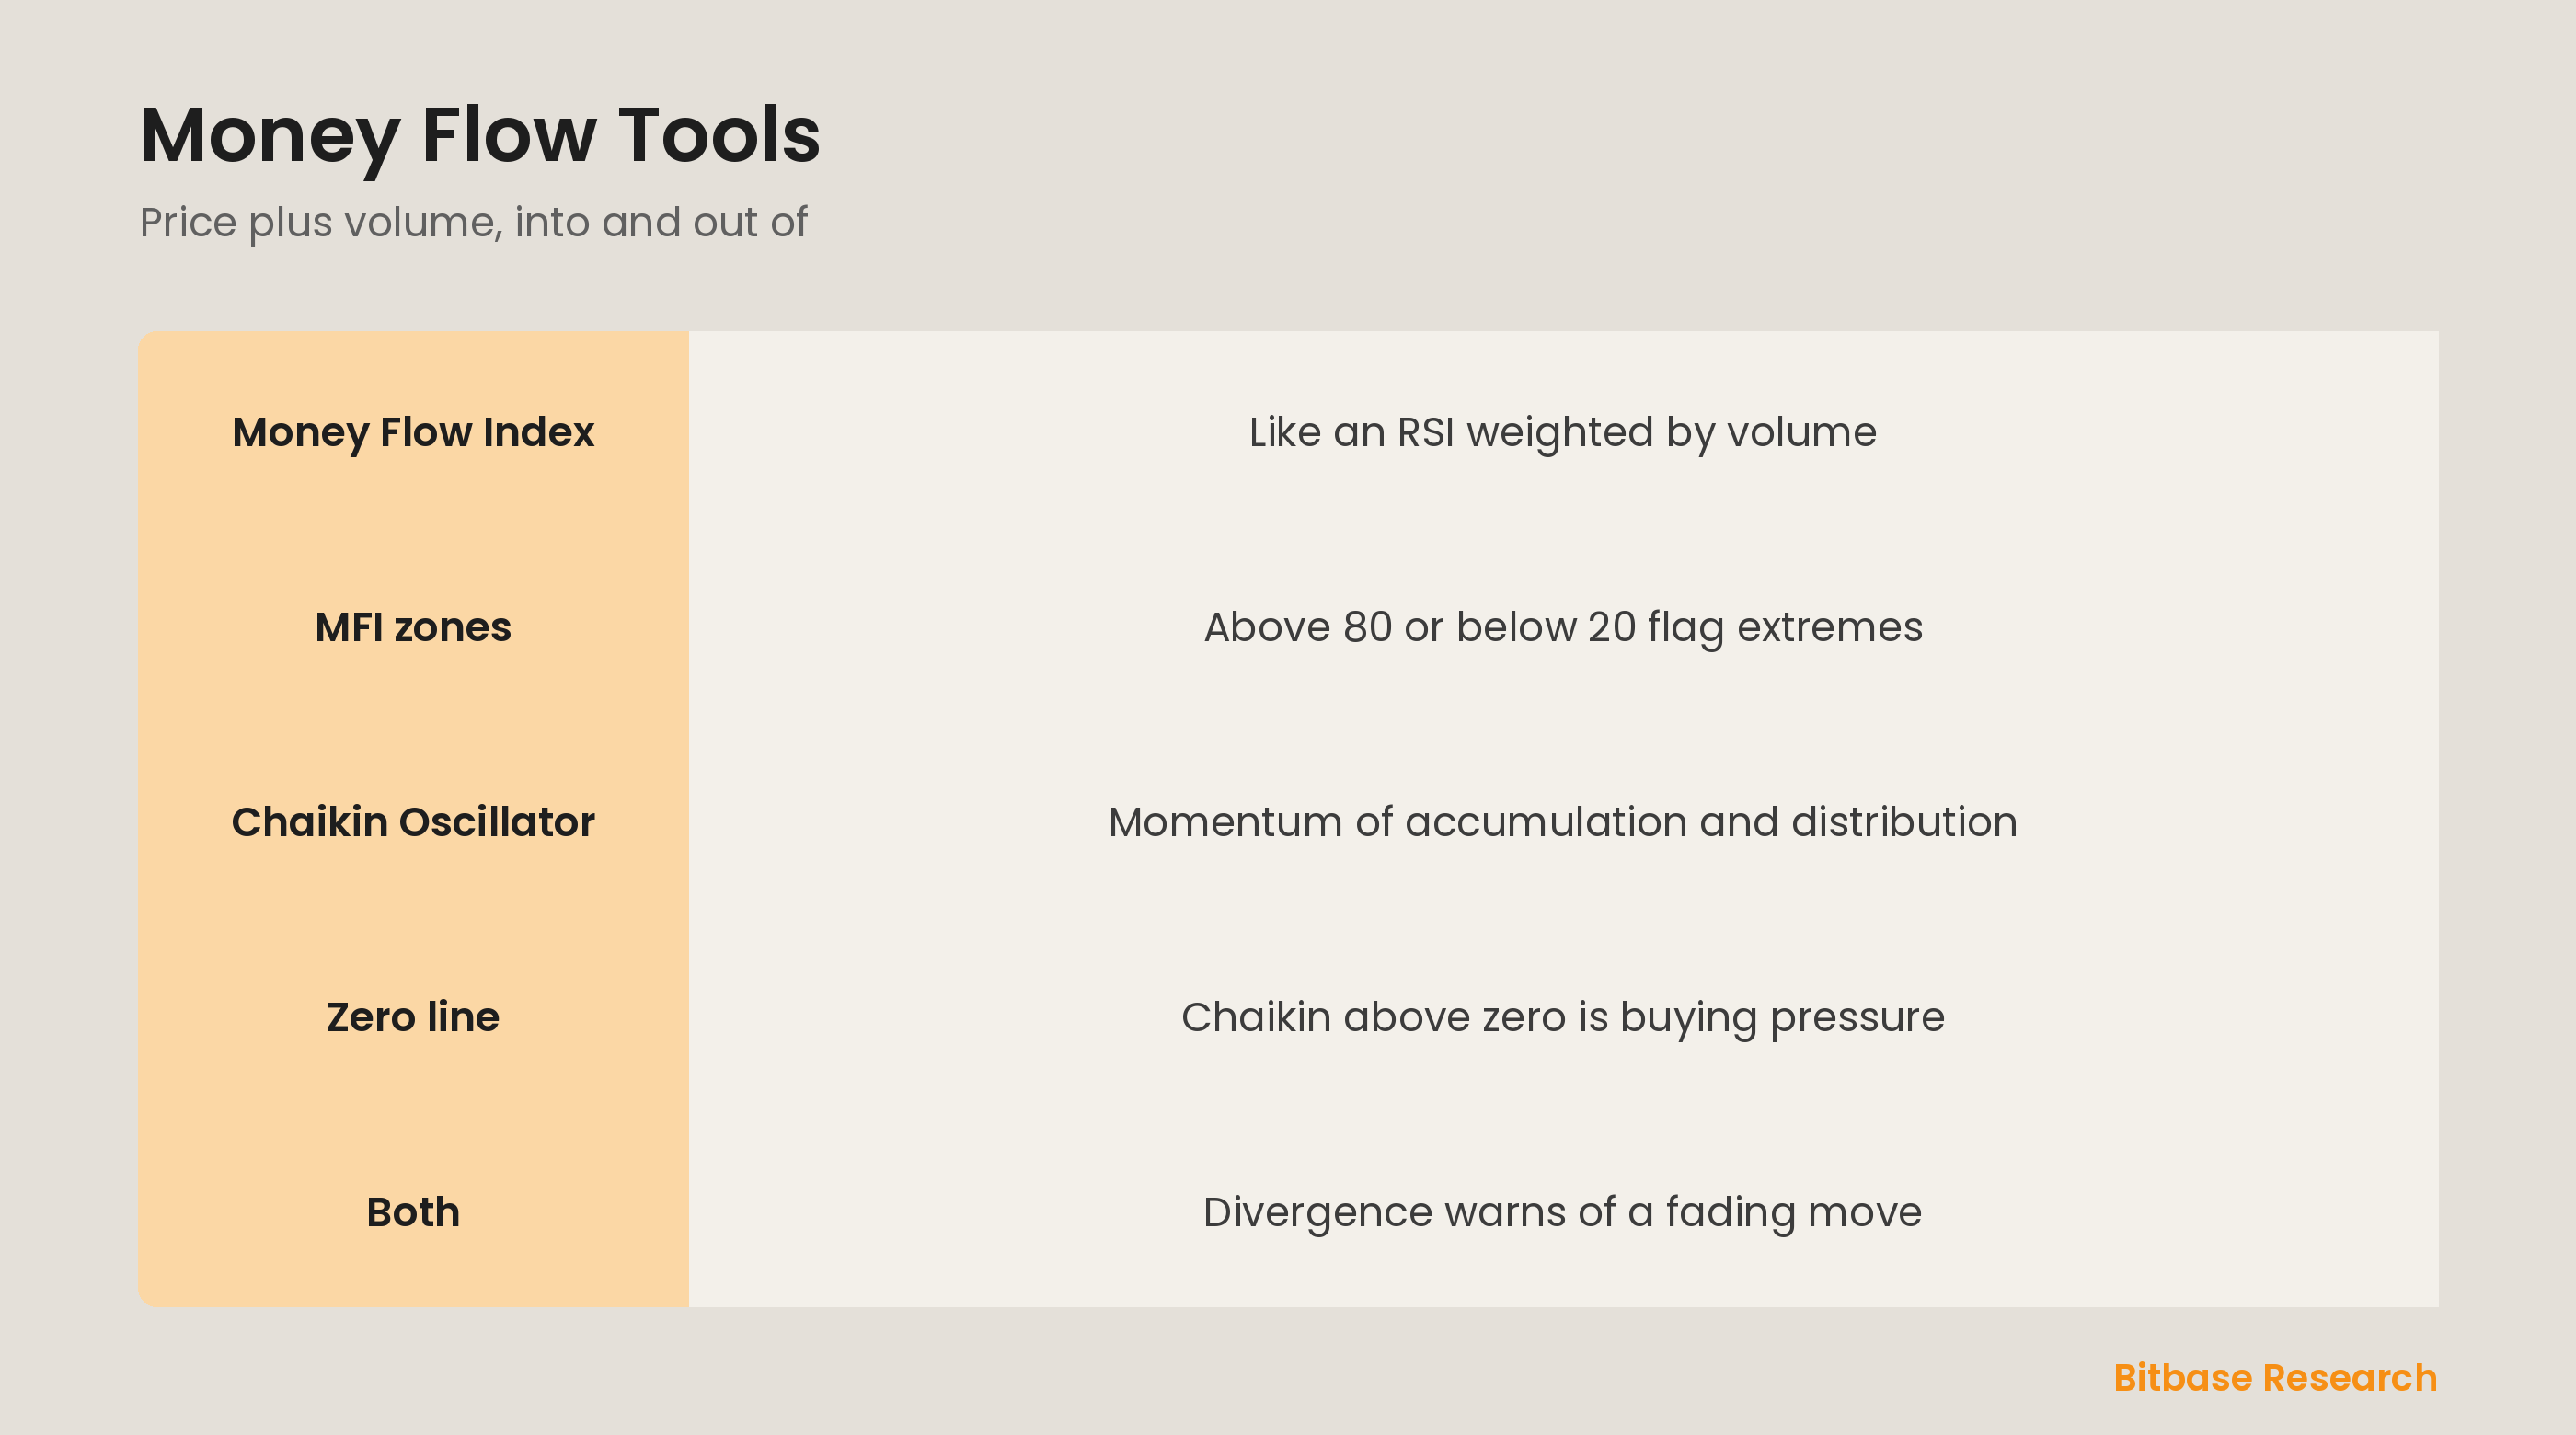
Because the MFI is scaled 0 to 100, it uses zones like the RSI, but at 80 and 20. A reading above 80 suggests strong money inflow that may be overextended, while below 20 suggests heavy outflow that may be stretched. As with all such tools, these are not automatic reversal signals; a strong trend can keep the MFI in a zone. Its added value over the RSI is that its readings are backed by volume, giving them extra weight.
The Chaikin Oscillator
The Chaikin Oscillator takes a different angle, measuring the momentum of accumulation and distribution, the flow of money based on where price closes within each period's range and the volume behind it. It oscillates around a zero line. When the Chaikin Oscillator is above zero, buying pressure and accumulation are dominant; when below zero, selling pressure and distribution rule. Crossings of the zero line and shifts in the oscillator flag changes in the underlying money flow.
Divergence in both
The most valued signal from both tools is divergence with price, just as with other momentum indicators. If price makes a new high but the MFI or Chaikin Oscillator makes a lower high, the money flow is not confirming the advance, hinting the move is weakening. If price makes a new low but the flow tool holds up, selling pressure is fading. Because these tools blend volume with price, their divergences can be especially telling about the real force behind a move.
The bottom line
The Money Flow Index is like a volume-weighted RSI on a 0 to 100 scale, with 80 and 20 as its zones, measuring the force of money flowing in and out. The Chaikin Oscillator measures the momentum of accumulation and distribution around a zero line, with above zero showing buying pressure. Both blend price and volume, and divergence between either tool and price is their most valued signal, warning that the money flow behind a move may be fading. To keep learning the fundamentals, follow more from Bitbase Academy.
Disclaimer: This article is educational content from Bitbase Academy, provided for information only. It does not constitute investment, trading, tax, or financial advice. Crypto assets are volatile; assess your own risk. Written as of June 2026; refer to the latest official information.
References
[1] Investopedia, "Money Flow Index (MFI): Definition and Uses" investopedia.com
[2] Investopedia, "Chaikin Oscillator: Definition, Calculation Formula, Example" investopedia.com
[3] Investopedia, "Volume: Definition in Trading and How To Use It" investopedia.com