
Chart patterns are recognizable shapes that price traces out again and again, and traders study them because each shape hints at what price may do next. Behind the intimidating names lies a simple split: some patterns suggest a trend will continue, others suggest it will reverse. Understanding that distinction, and the psychology that creates these shapes, is the key to using them. Here is an overview of chart patterns and how they work.
What a chart pattern is
A chart pattern is a distinctive formation in the shape of price on a chart, one that has appeared often enough that traders have named it and learned what tends to follow. Patterns form because price does not move randomly; the ongoing battle between buyers and sellers leaves recognizable footprints. A pattern is essentially a snapshot of that battle at a turning point or a pause, packaged into a shape that hints at the likely next move.
Continuation patterns
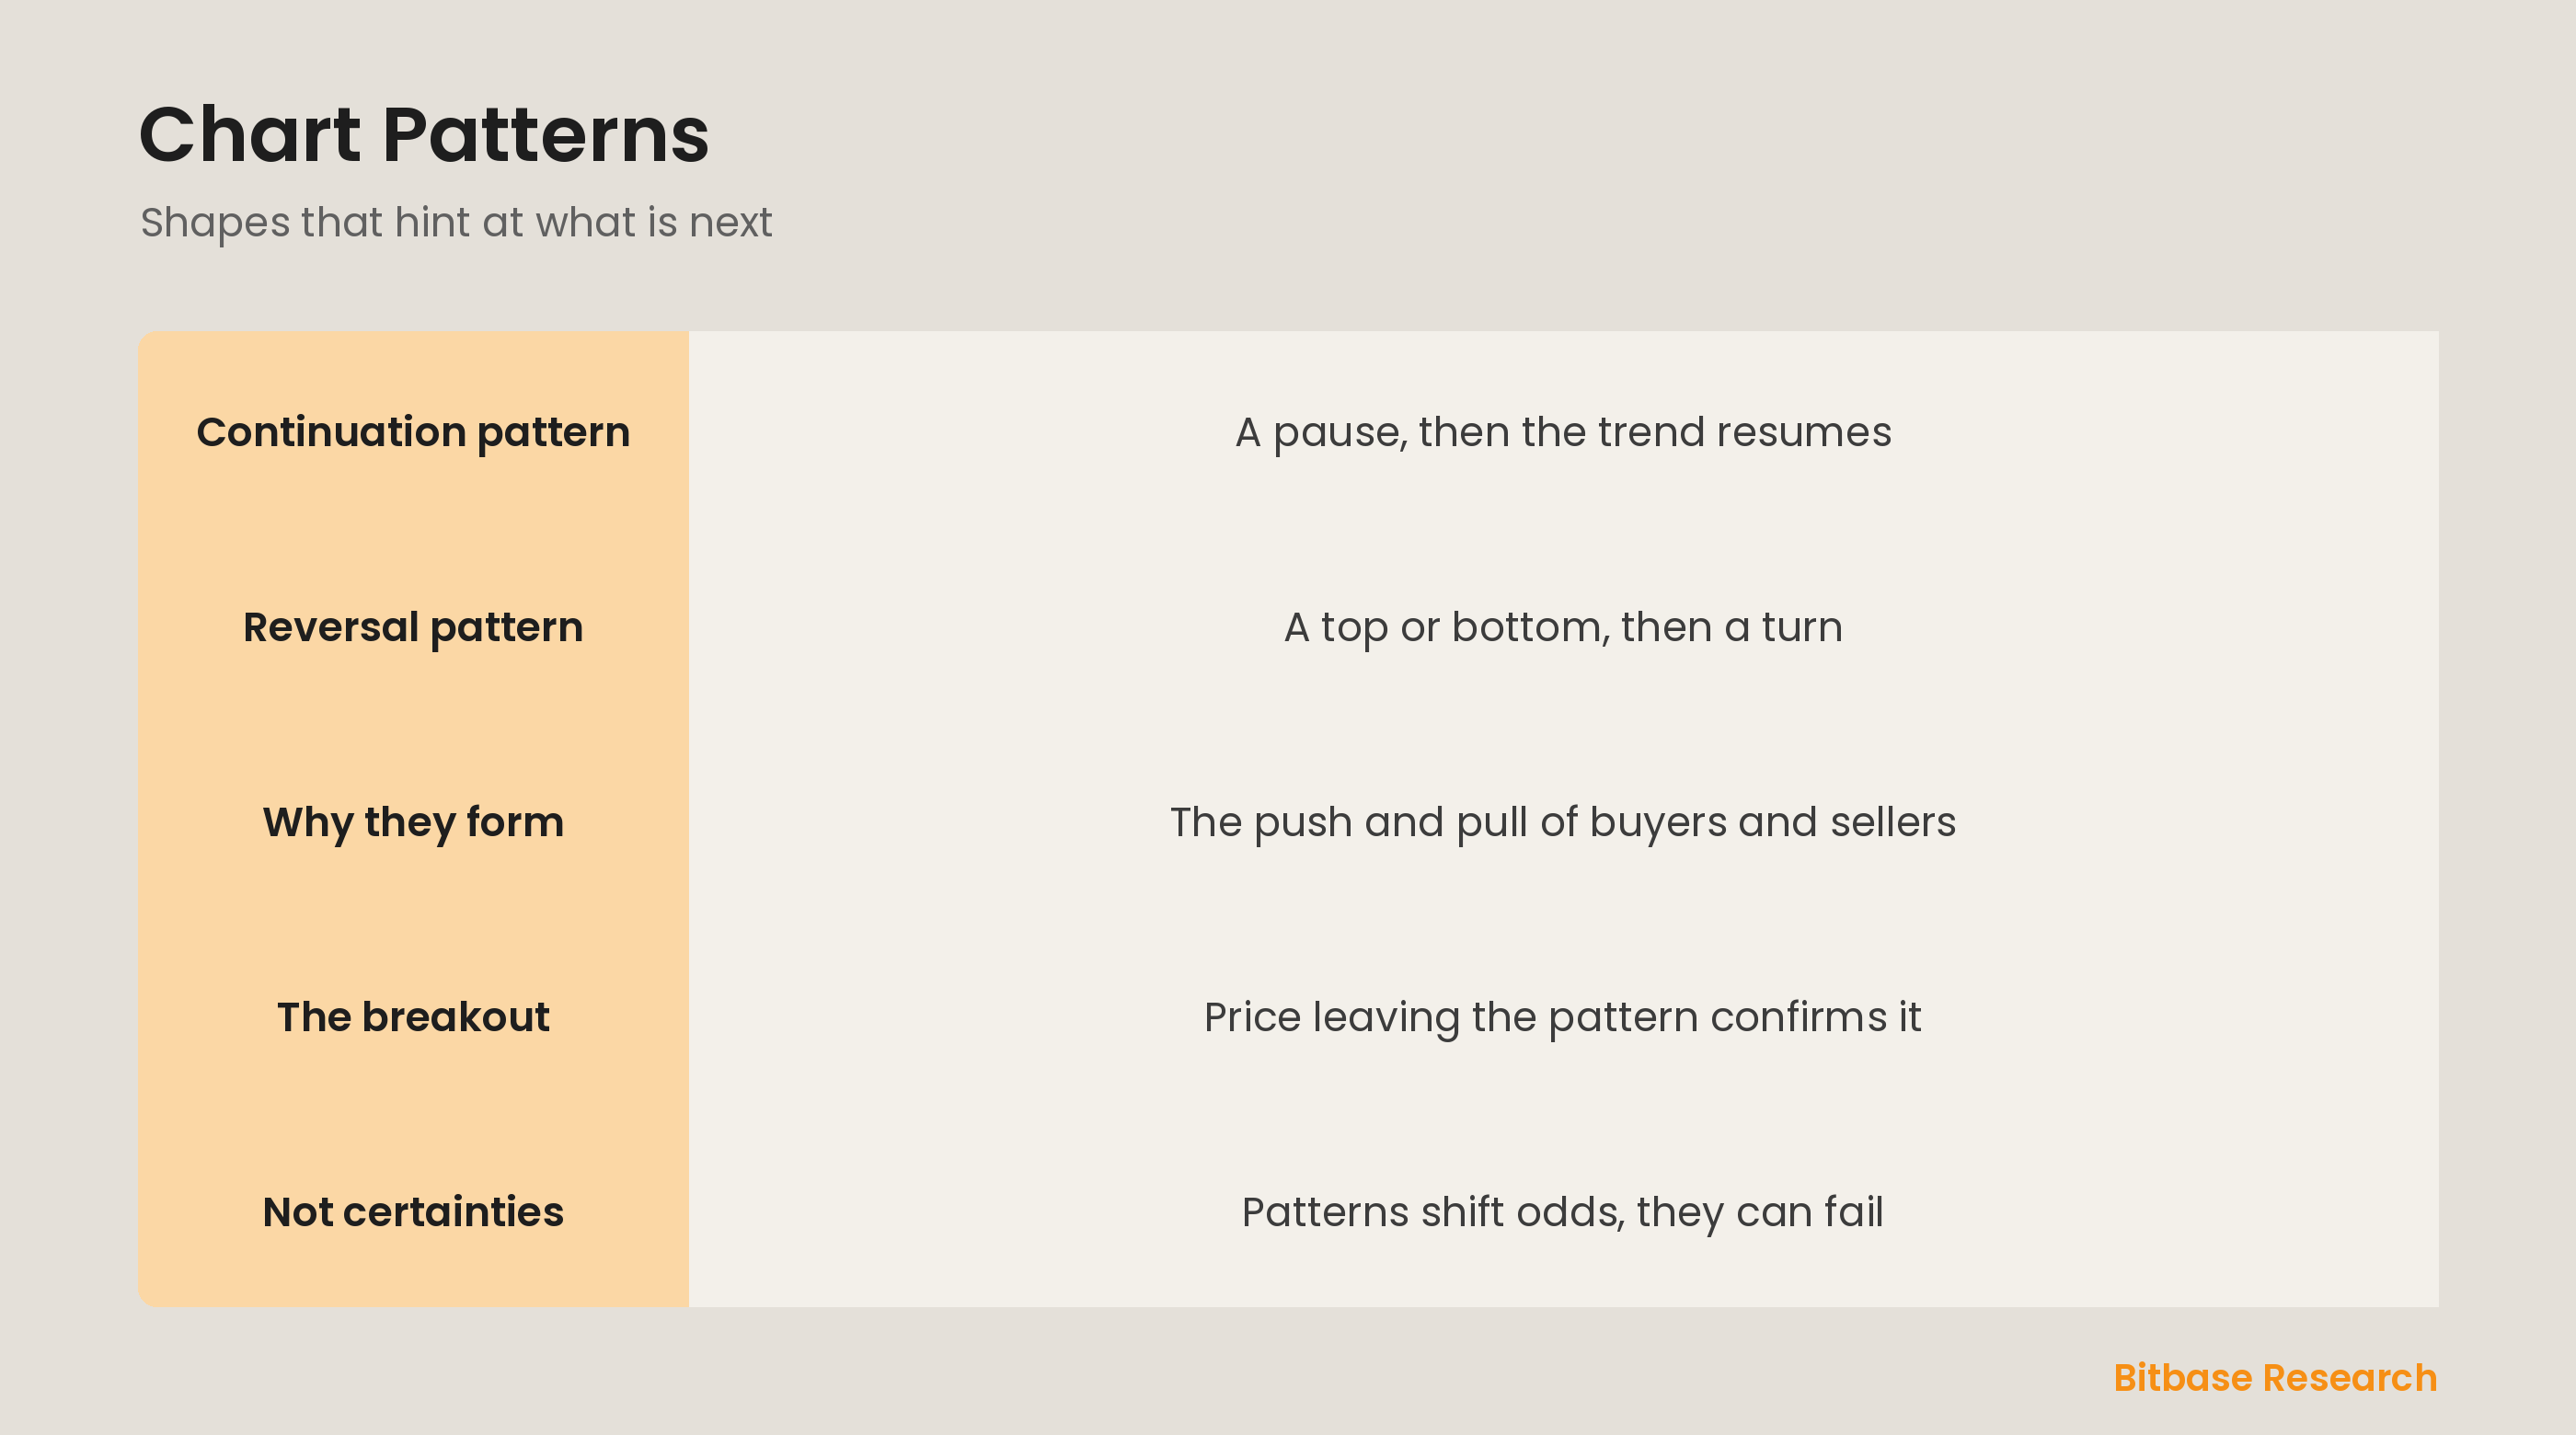
Continuation patterns form during a pause in a trend and suggest the trend will resume in the same direction after the pattern completes. They represent a rest, where the market catches its breath before continuing. Flags, pennants, and many triangles are continuation patterns: price consolidates in a tight shape mid-trend, then breaks out to carry on the way it was going. Spotting a continuation pattern helps a trader stay with a trend through its pauses rather than exiting too early.
Reversal patterns
Reversal patterns form at the end of a trend and suggest it is about to turn the other way. They represent a shift in control, where the side that had been winning runs out of strength. Head and shoulders, double tops, and double bottoms are classic reversal patterns, marking tops and bottoms where an uptrend becomes a downtrend or vice versa. Recognizing a reversal pattern warns a trader that the prevailing trend may be ending.
Why patterns form and how to use them
Patterns arise from crowd psychology, the repeating ways buyers and sellers push and pull at key moments, which is why the same shapes recur across markets. To use one, traders wait for confirmation: the pattern is only validated when price breaks out of it in the expected direction, ideally on strong volume. Even then, patterns are probabilities, not certainties, and they can fail, so they work best combined with the trend, levels, and volume.
The bottom line
Chart patterns are recognizable shapes price forms from the tug of war between buyers and sellers, and they split into two families: continuation patterns, which suggest a trend will resume after a pause, and reversal patterns, which suggest a trend is about to turn. A pattern is confirmed when price breaks out of it, ideally on volume, but patterns are probabilities that can fail, so they are best used alongside trend, structure, and other signals. To keep learning the fundamentals, follow more from Bitbase Academy.
Disclaimer: This article is educational content from Bitbase Academy, provided for information only. It does not constitute investment, trading, tax, or financial advice. Crypto assets are volatile; assess your own risk. Written as of June 2026; refer to the latest official information.
References
[1] Investopedia, "Continuation Pattern: Definition and Trading Strategies" investopedia.com
[2] Investopedia, "Technical Analysis: What It Is and How to Use It" investopedia.com
[3] Investopedia, "Trend: Definition, Types, Examples, and Uses in Trading" investopedia.com