Beyond the famous RSI and stochastic, two more momentum oscillators show up often on charts: the CCI and Williams %R. Both do a similar job, flagging when a move has stretched too far, but each measures it in its own way and uses its own scale. Knowing how they differ helps you read them without confusion. Here is what the CCI and Williams %R measure and how to interpret their levels.
What the CCI measures
The CCI, or Commodity Channel Index, measures how far the current price has strayed from its average over a recent period. When price is far above its average, the CCI reads high and positive; when far below, low and negative; near the average, close to zero. Unlike bounded oscillators, the CCI is not capped at fixed limits, so it can run to large values in strong moves. It captures how overextended price is relative to its own recent norm.
Reading the CCI
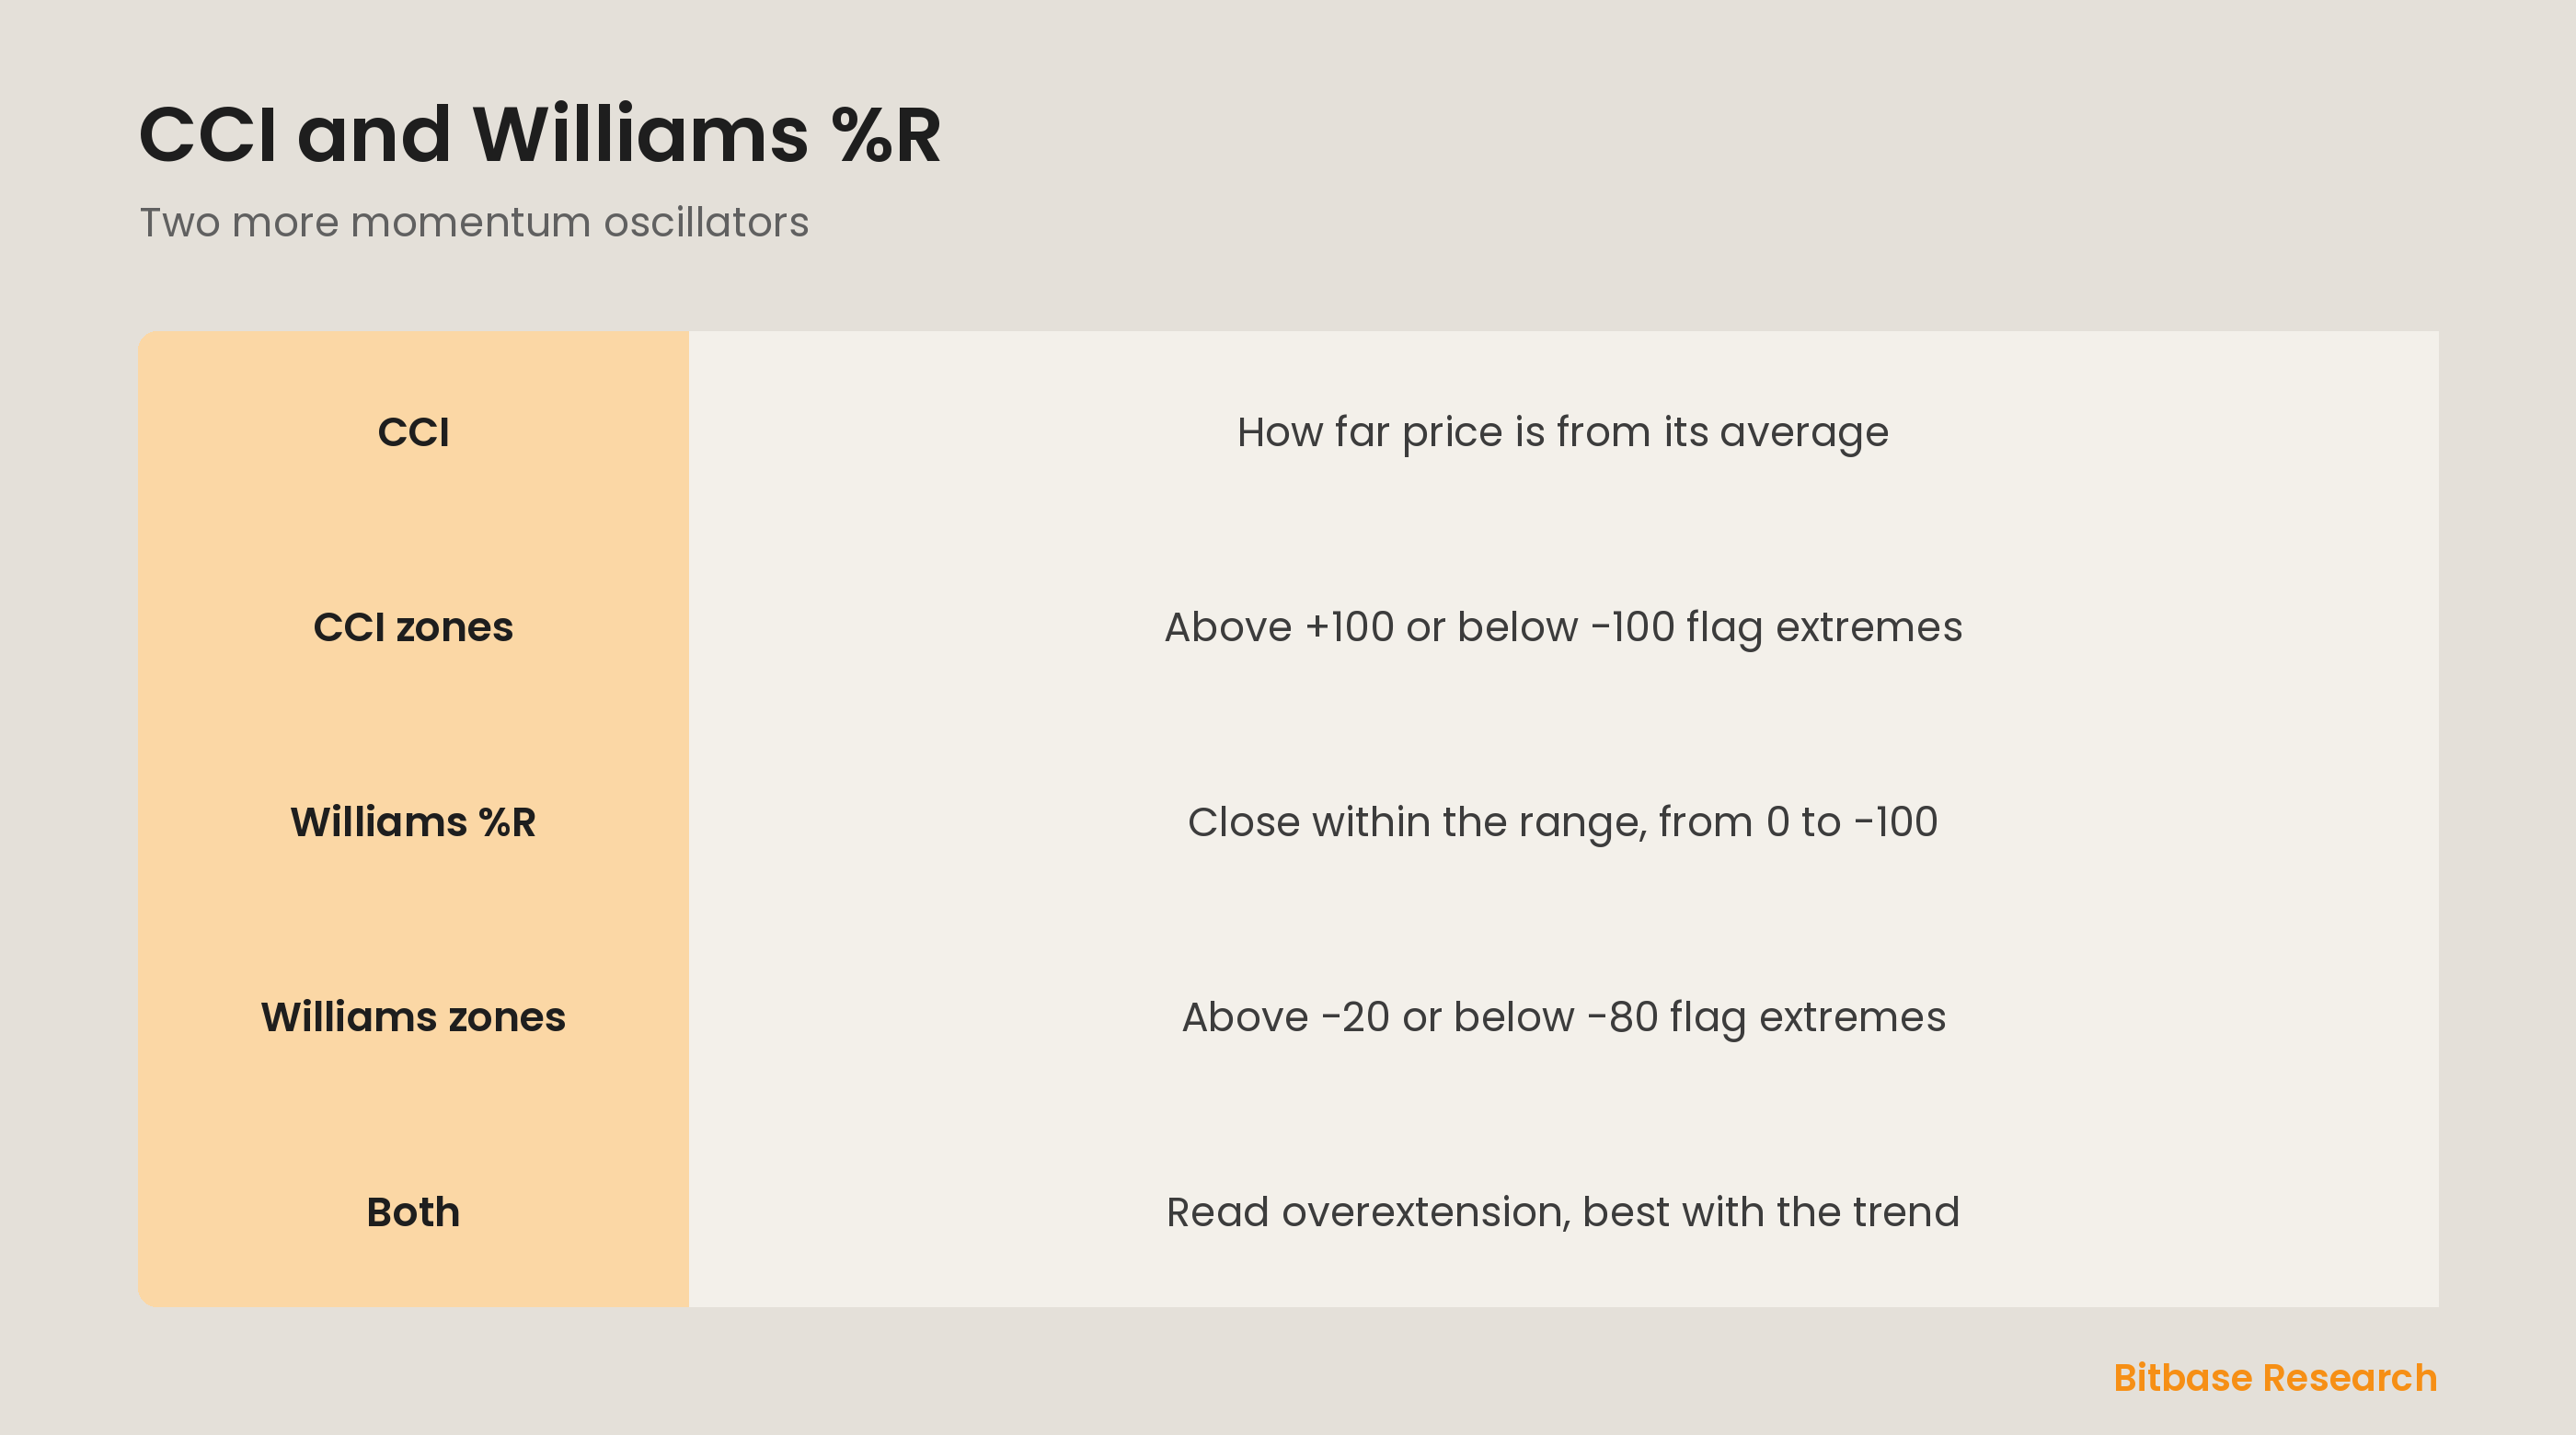
The CCI is read with reference levels at +100 and -100. Readings above +100 suggest price has pushed unusually far above its average, a strong or possibly overextended up move; readings below -100 suggest the opposite. Between these levels, price is within its normal range. As with all such tools, in a strong trend the CCI can stay beyond +100 or -100 for a while, so extreme readings flag strength and stretch rather than an automatic reversal.
What Williams %R measures
Williams %R measures where the current close sits within the recent high-low range, much like the stochastic but on an inverted scale from 0 to -100. A reading near 0 means the close is near the top of the range, strong upward momentum; a reading near -100 means the close is near the bottom. It answers the same question as the stochastic, how close price is to its recent extremes, just expressed with negative numbers that can look unfamiliar at first.
Reading Williams %R and comparing
Williams %R uses -20 and -80 as its zones. Above -20, near the top, is considered overbought; below -80, near the bottom, oversold. So both tools flag overextension, but the CCI measures distance from an average while Williams %R measures position within a range, similar to the stochastic. Neither is a standalone reversal signal, and both work best confirmed by the trend, used as extra evidence that a move is stretched rather than as automatic triggers.
The bottom line
The CCI measures how far price has strayed from its recent average, flagging extremes above +100 and below -100, while Williams %R measures where the close sits in the recent range on a scale from 0 to -100, with overbought above -20 and oversold below -80. Both are momentum oscillators that flag overextension in their own ways, and like all such tools, they are best read alongside the trend rather than as automatic buy or sell signals. To keep learning the fundamentals, follow more from Bitbase Academy.
Disclaimer: This article is educational content from Bitbase Academy, provided for information only. It does not constitute investment, trading, tax, or financial advice. Crypto assets are volatile; assess your own risk. Written as of June 2026; refer to the latest official information.
References
[1] Investopedia, "Commodity Channel Index (CCI): Definition and Uses" investopedia.com
[2] Investopedia, "Williams %R: Definition, Formula, Uses, and Limitations" investopedia.com
[3] Investopedia, "Technical Analysis: What It Is and How to Use It" investopedia.com