


In brief
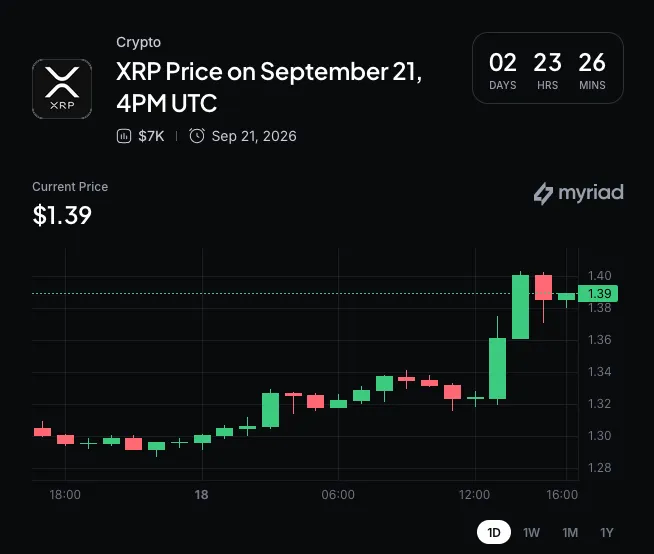
- XRP jumped 6.93% on the day, opening at $1.2964 and topping out at $1.4028 before settling near $1.3863—one of its sharpest single-day moves in weeks.
- The gap between XRP's 50-day and 200-day EMAs on the daily chart has narrowed to its tightest point since August 2024, and a golden cross could form as soon as mid-October if the current pace holds.
- That same crossover already happened on the noisier 4-hour chart back on August 21—but the gap has been closing instead of widening since then, a warning sign the daily golden cross isn't a lock.
Crypto traders are breathing a little easier today. After a rough stretch defined by a Federal Reserve rate hike, the Senate's 49-50 vote against advancing the Clarity Act, and a surprise rate hike from the Bank of Japan, Bitcoin has clawed its way back above $80,000.
That recovery is showing up clearest in the altcoin space: Bitcoin's dominance, or its share of total crypto market value, slipped from 64% to 59%, a sign that traders are rotating profits into smaller tokens.
XRP, the cryptocurrency created by the co-founders of payments company Ripple, is one of the biggest beneficiaries of that rotation.
XRP opened the day at $1.2964 and pushed as high as $1.4028 before settling near $1.3863, a gain of 6.93% on the daily candle and one of its sharpest single-day moves in weeks.
The bigger story is what's happening under the hood. XRP's daily chart still shows its 50-day exponential moving average, or EMA, trading below its 200-day EMA—the bearish setup chart watchers call a "death cross" structure. The pattern is considered bearish because it signals to traders that holding the asset in the short-term is worse than trading it.
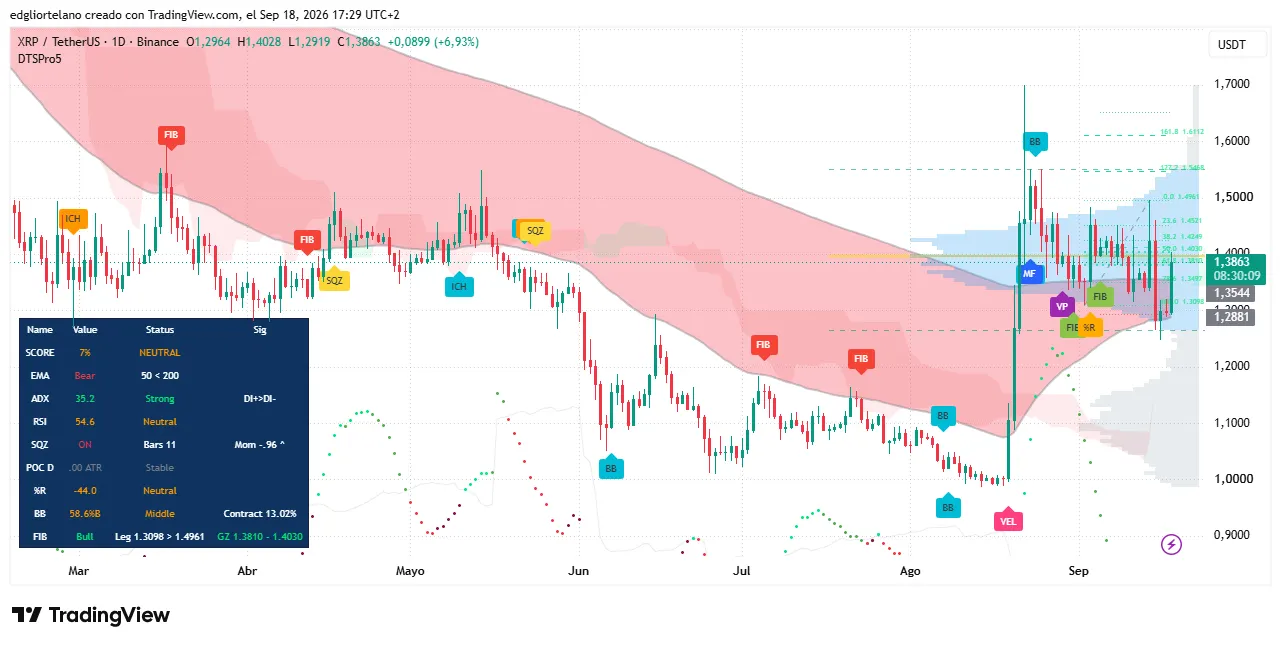
But the gap between the averages has narrowed sharply. So much that it’s the tightest gap since XRP's last golden cross in August 2024.
A golden cross, the opposite of a death cross, happens when the shorter-term average crosses above the longer-term one, and traders widely read it as a signal that bullish momentum has real staying power rather than being just a short-term squeeze. If today's pace of gains holds, that crossover could show up on the daily chart as soon as mid-October.
There's a wrinkle, though. On the noisier 4-hour chart, XRP's EMAs already flipped into a golden cross back on August 21. But instead of that gap widening the way a healthy breakout usually plays out, it's been closing again.
A crossover that fails to hold on a shorter timeframe doesn't guarantee the same setup confirms on the daily chart. Even if usually shorter timeframes set the pace for what analysis will see on longer time frames, some experts believe this is not something that should be taken into consideration and each time frame should be studied independently.
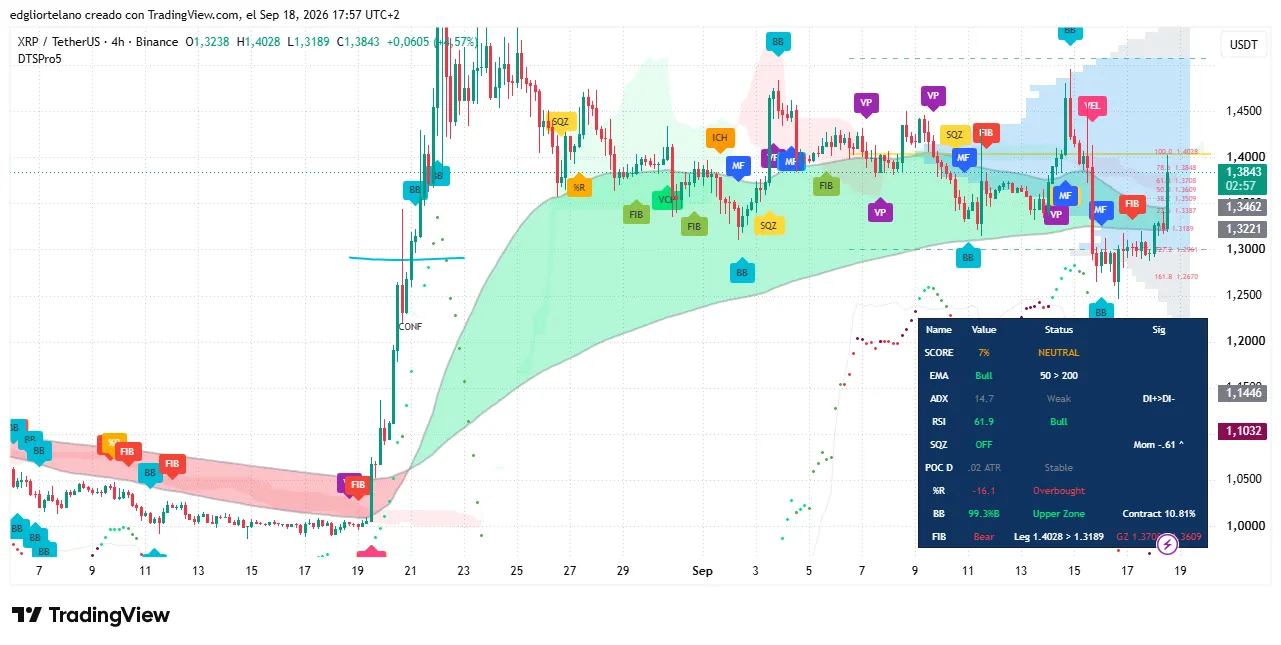
The rest of the indicator board in the daily charts is more encouraging. The Average Directional Index, or ADX, measures how strong a trend is regardless of direction. For XRP, it’s currently at 35.2—comfortably above the 25 level traders use as the line between a real trend and aimless chop, with the positive directional line (DI+) currently running above the negative one (DI-), meaning that strength is pointing higher.
The Relative Strength Index, or RSI, sits at 54.6, squarely in neutral territory—a healthy reading for a coin that just posted a near-7% daily gain, since it means XRP isn't flashing overbought yet and still has room to run before profit-taking becomes a real risk.
XRP's Squeeze Momentum Indicator has also been flashing "on" for 11 straight bars, a sign volatility has been compressing, which traders generally read as a setup for a bigger move once it releases.
The momentum reading inside that squeeze has been climbing back toward positive territory, hinting the next move is more likely up than down, but its not guaranteed considering the longer timeframe.

BitcoinBTC · USD
$80,850+3.76%
Sep 11Sep 13Sep 15Sep 16Sep 18
$80.9k$79.1k$77.3k$75.5k
24h HighHigh$81,055
24h LowLow$76,205
VolVol$1.7B
Market projectionsOdds by Myriad
Today$80,000 to $82,000$80k–$82k68% chanceThis week$80,000 to $82,000$80k–$82k68% chance
Price data by CoinGeckoCoinGeckoMore Bitcoin news and projections →
The macro backdrop has helped too. Even with the Clarity Act stalling out in the Senate this week, Bitcoin absorbed the news without giving up ground, holding its range and dragging sentiment across the board higher as the week wraps up.
That kind of resilience from Bitcoin, combined with capital rotating into altcoins, is exactly the kind of tailwind XRP needs if it's going to keep closing the gap between its moving averages.
Traders will be watching two things over the coming weeks: whether Bitcoin's rebound holds up enough for the altcoin rotation to keep going, and whether XRP's 50-day EMA can actually climb above its 200-day counterpart on the daily chart.
A confirmed golden cross around mid-October, paired with ADX holding above 25, would go a long way toward validating the current bounce. A failure to hold the $1.38 golden zone, on the other hand, would raise the odds that this is just another squeeze that fizzles out before the crossover ever confirms.
Disclaimer
The views and opinions expressed by the author are for informational purposes only and do not constitute financial, investment, or other advice.