Issue 15 closed on a warning: the market had rallied on a June CPI print whose own driver—an energy swoon—had already reversed by that Friday. This week the reversal finished the job. Brent crude topped $100 a barrel as the US–Iran conflict widened and then shed about 4% on Friday to settle near $97, while WTI ended Friday at $89.87—down 2.52% on the session but up 8.9% across the five days [1][2]. The Strait of Hormuz is running at a fraction of capacity—PortWatch's most recent published day, July 19, recorded just 15 transits against a pre-crisis baseline of 88 per day—and the Red Sea joined it as a second choke point [3][4]. The disinflation story did not merely stall. Its mechanism ran backwards.
The rates market repriced accordingly, and violently. Odds of a July hike, which the cool CPI had crushed into the teens, climbed from 10.7% on July 15 to 38% by July 24 on CME FedWatch, tripling inside nine sessions [5][6]. The two macro legs this series tracks both moved the wrong way. The 2-year Treasury closed July 24 at about 4.33%, further above the 4.1% threshold Issue 14 set and higher than the 4.18% Issue 15 reported [7]. The dollar index closed at 101.46, near a one-month high and now decisively above its ~100.8 mark rather than marginally under it [8]. Issue 15 described one leg scraping under and one moving wrong. This week neither is close.
And yet the signal this series has tracked longest gave a second reading. Money-market fund assets fell $22.57 billion to $7.86 trillion for the week ended July 22, a second consecutive weekly drawdown from the record $7.95 trillion [9]. Issue 15 called its first drawdown a datapoint and asked whether a second would follow. It did—smaller, and with the same institutional fingerprint.
What makes this issue coherent is that the week's three biggest moves all describe the same thing from different angles: relief being withdrawn. Oil took back the disinflation. The rates market took back the dovish repricing. And the ETF bid, which had extended to a seventh straight day, took itself back on Friday in the single largest outflow BlackRock's fund has ever had.
Week of July 20 to July 26, 2026
Bitbase Research · July 27, 2026
The one chart that matters
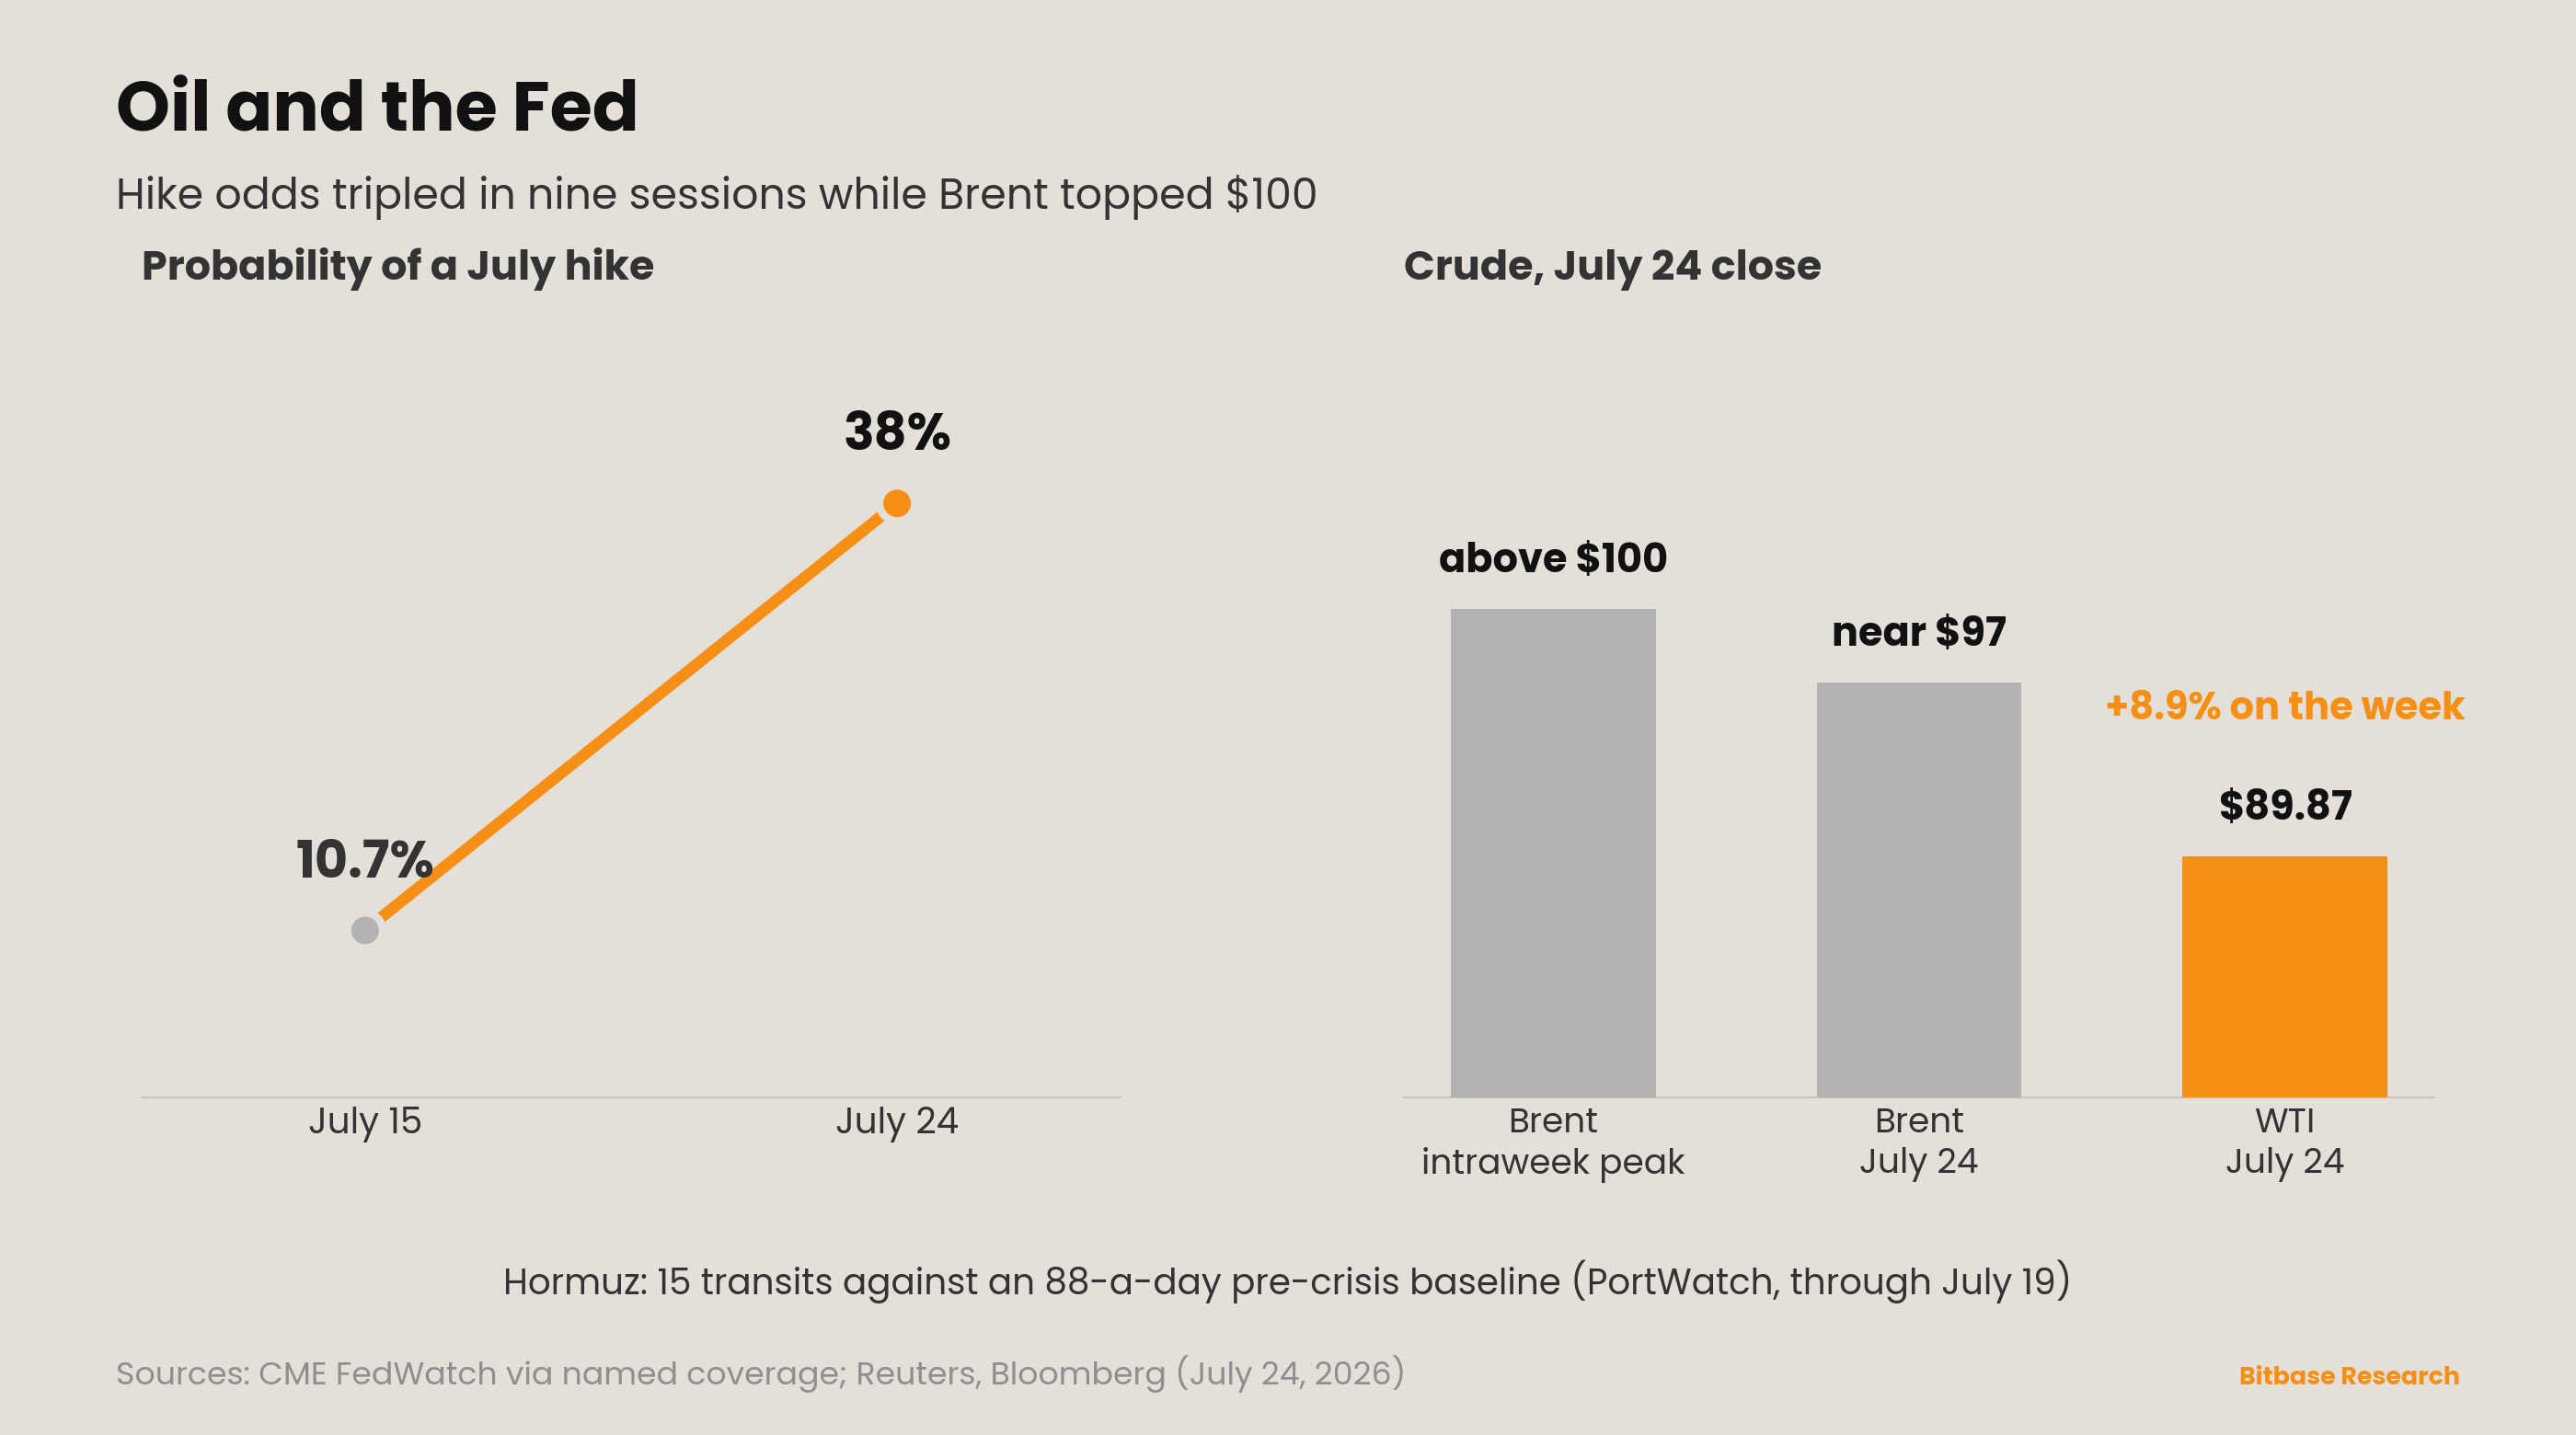
The two lines on this chart were not supposed to move together, and that is the point. Nine sessions ago the market was pricing a July hike at 10.7%, having just received the softest CPI print in more than six years. By July 24 it priced 38% [5][6]. Nothing in the inflation data changed in between—June CPI is a closed number. What changed was the price of the thing that produced it.
Crude's path through the week explains the entire repricing. Brent topped $100 a barrel at the peak of the conflict escalation before shedding about 4% on Friday to settle near $97, while WTI, the US benchmark, ended Friday at $89.87, down 2.52% on the session but up 8.9% on the week [1][2]. That is the mirror image of June: the same component that delivered a −0.4% monthly headline by falling is now rising at a comparable pace. A basket weight does not care which direction it moves.
The physical constraint is what makes this hard to dismiss as a risk premium. Hormuz is not merely expensive to transit; it is barely being transited. 15 vessels against a baseline of 88 per day is an 83% reduction, and that reading is from July 19—the most recent day PortWatch had published, before the Red Sea became a second choke point later in the week [3][4]. A geopolitical premium unwinds when sentiment improves. A closed waterway unwinds when it reopens, and nothing this week suggested it was about to.
The honest framing for the July CPI due next month is arithmetic, not forecast. June's improvement was energy-led by the BLS's own composition. If oil holds anywhere near these levels through the month, the component that supplied the entire undershoot supplies the overshoot instead. The market did not mis-read June. It over-extrapolated a one-month move in the least persistent part of the basket—which is exactly what Issue 15 said the risk was, one week before it materialised.
This week's structural signal
The relief unwound in the same shape it was built—concentrated, wrapper-led, and fast.
Track the ETF sequence and the whole week is legible. The inflow run that Issue 15 reported at four sessions did not stop at four. It reached seven consecutive days through July 22, pulling in close to $1 billion cumulatively [10][11]. This week's portion was $499.05 million, of which BlackRock's IBIT took $319.16 million—$116.48 million on July 20, $163.90 million on July 21, $38.78 million on July 22 [10]. Concentration held exactly as Issue 15 described it.
Then it broke, and it broke through the same concentration. July 23 turned negative at −$225 million. July 24 was worse: −$240.1 million across the complex, of which IBIT alone shed $212.2 million—the largest single-day outflow in the fund's history [11][12]. The wrapper that carried the rally carried the reversal, at greater speed.
The scale check is the part worth keeping. Seven straight days of inflows, adding up to roughly a billion dollars, recovered only about 15% of what these funds lost in June [10]. A streak that reads impressive in session count reads modest against the hole it was filling—and then gave part of itself back inside two sessions. The bid is real, concentrated, and thin. Those three properties are not in tension; they are the same fact seen from three sides.
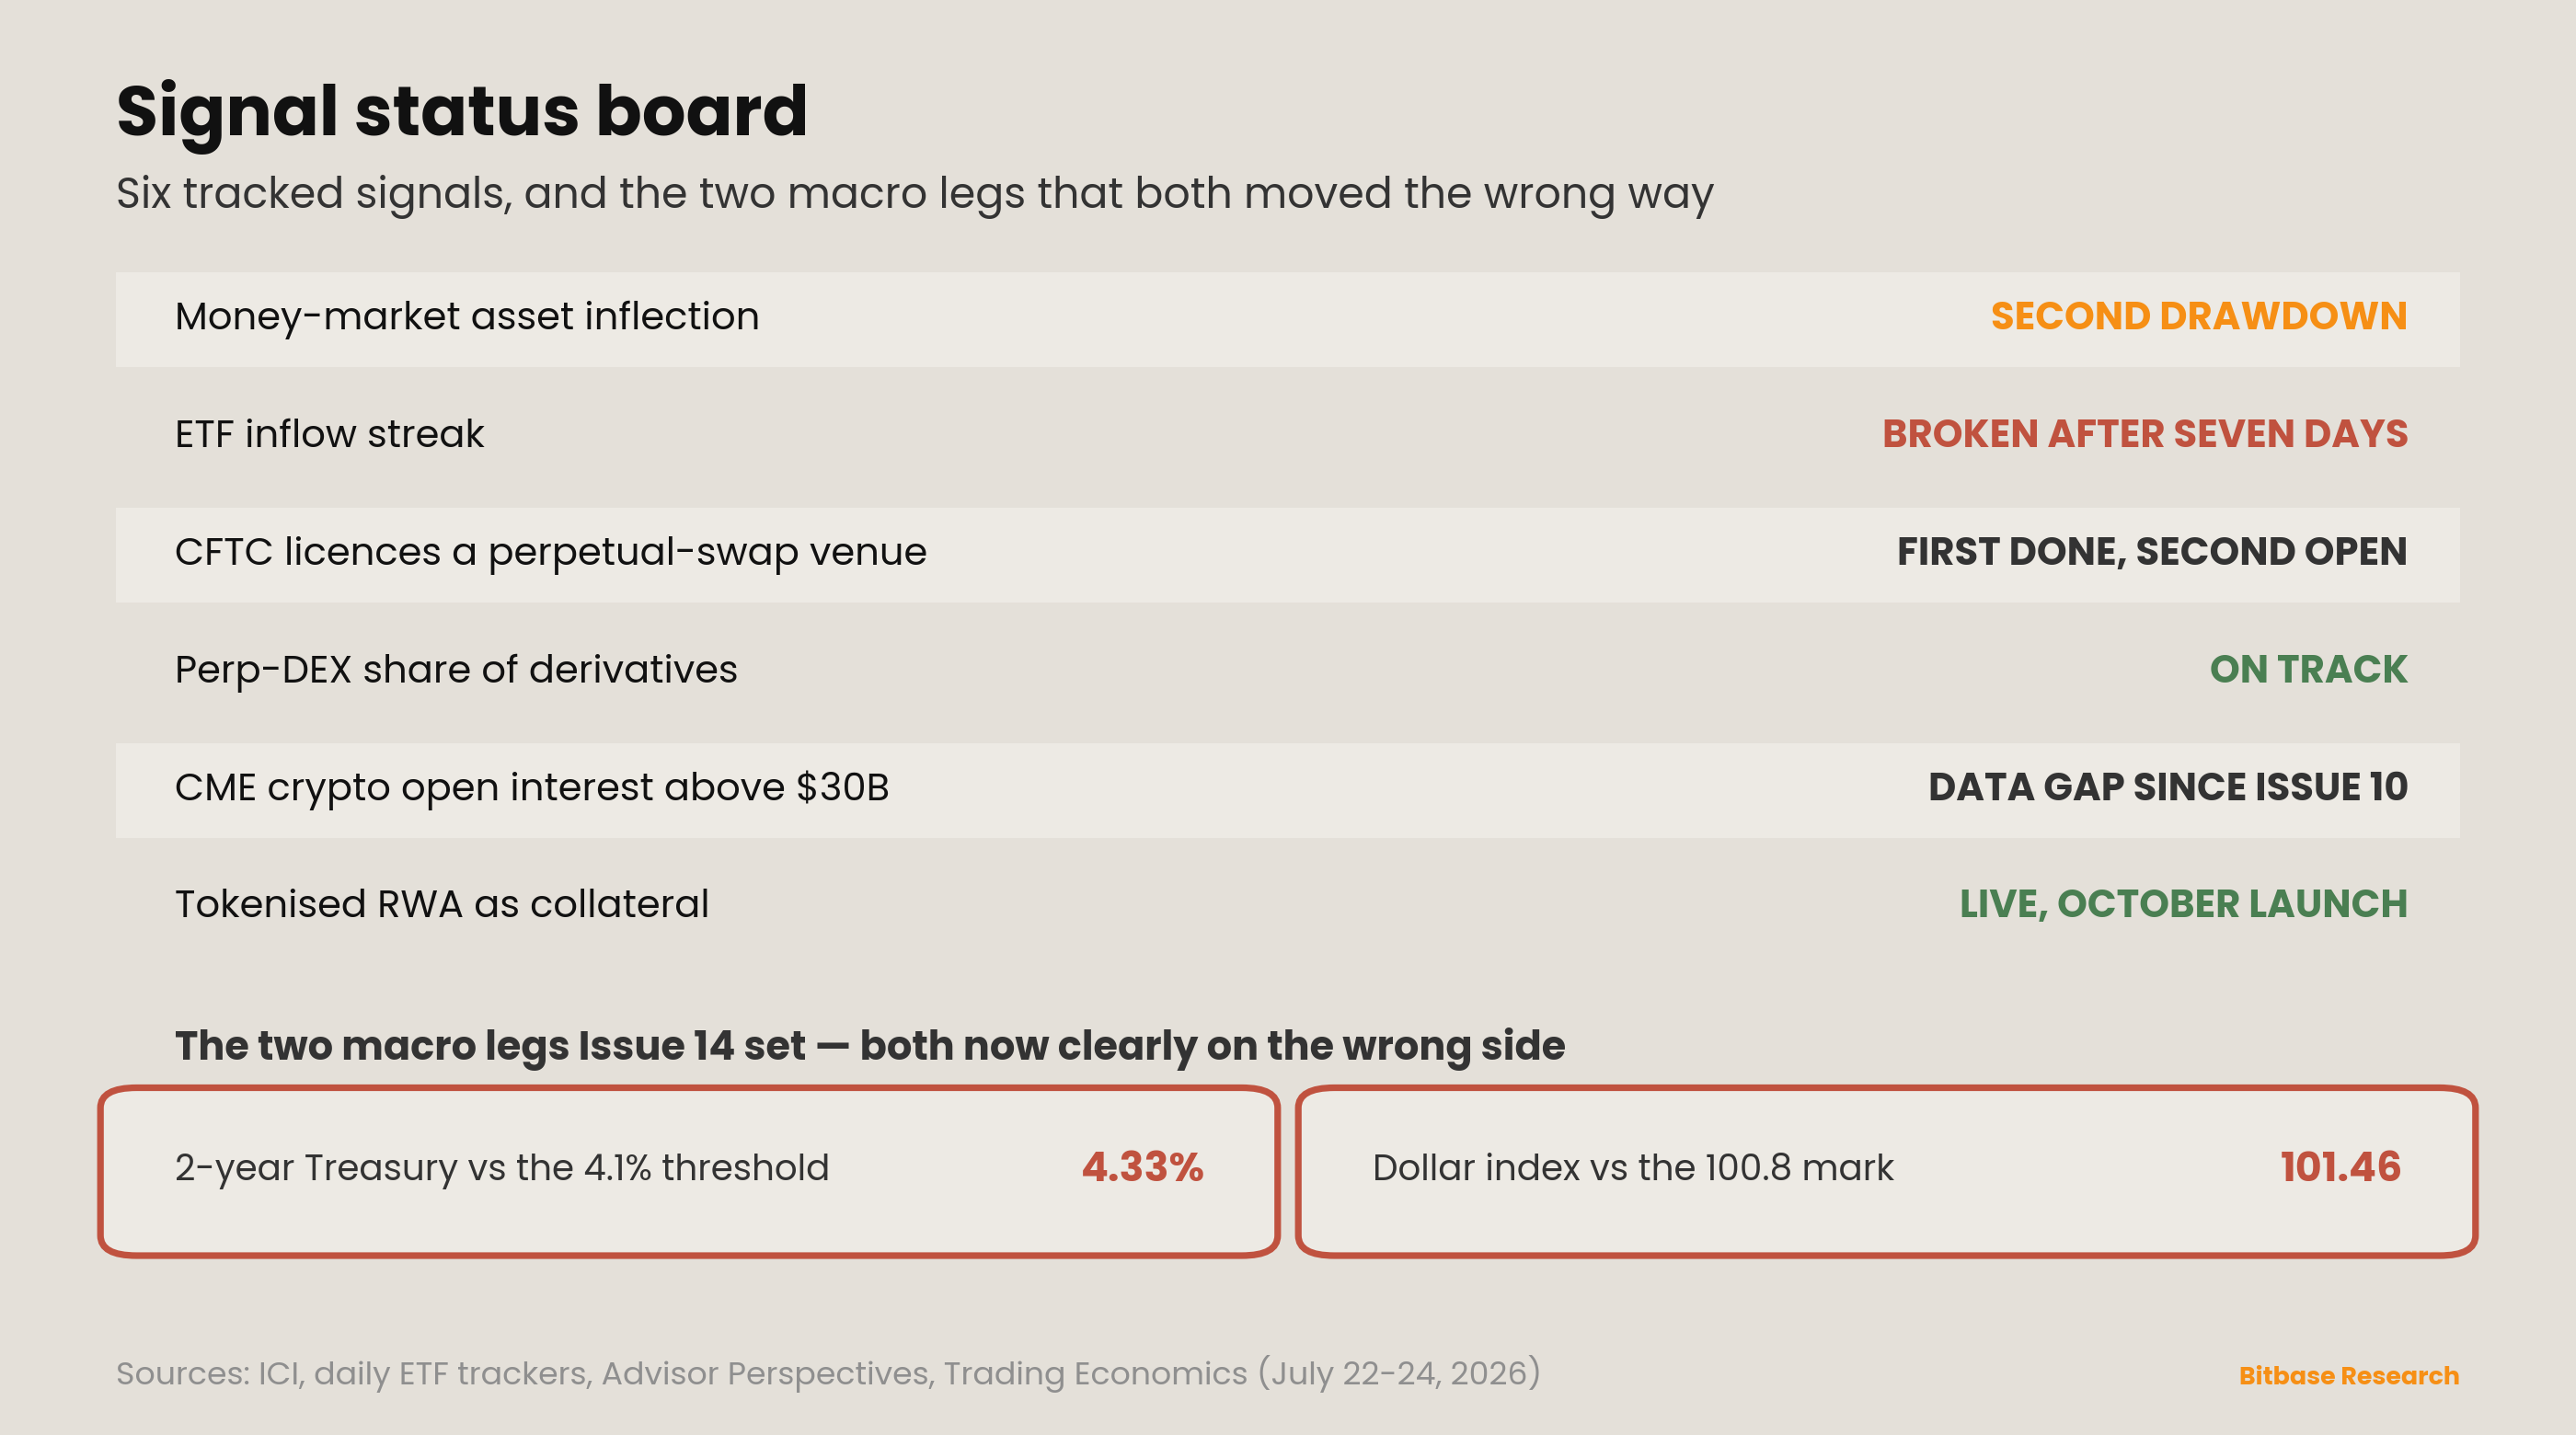
Neither macro leg offers cover this time. Issue 14 set the thresholds—2-year near 4.1%, dollar index near 100.8—and Issue 15 reported one marginally under and one moving wrong. This week the 2-year closed July 24 at roughly 4.33% and the dollar index at 101.46, near a one-month high [7][8]. Both are now clearly on the wrong side. Friday's crypto retreat was attributed directly to higher Treasury yields [13], which is the cleanest expression of the link this series tracks: when the front end reprices hawkish, the wrapper bid is the first thing to go.
Dual-track scoreboard
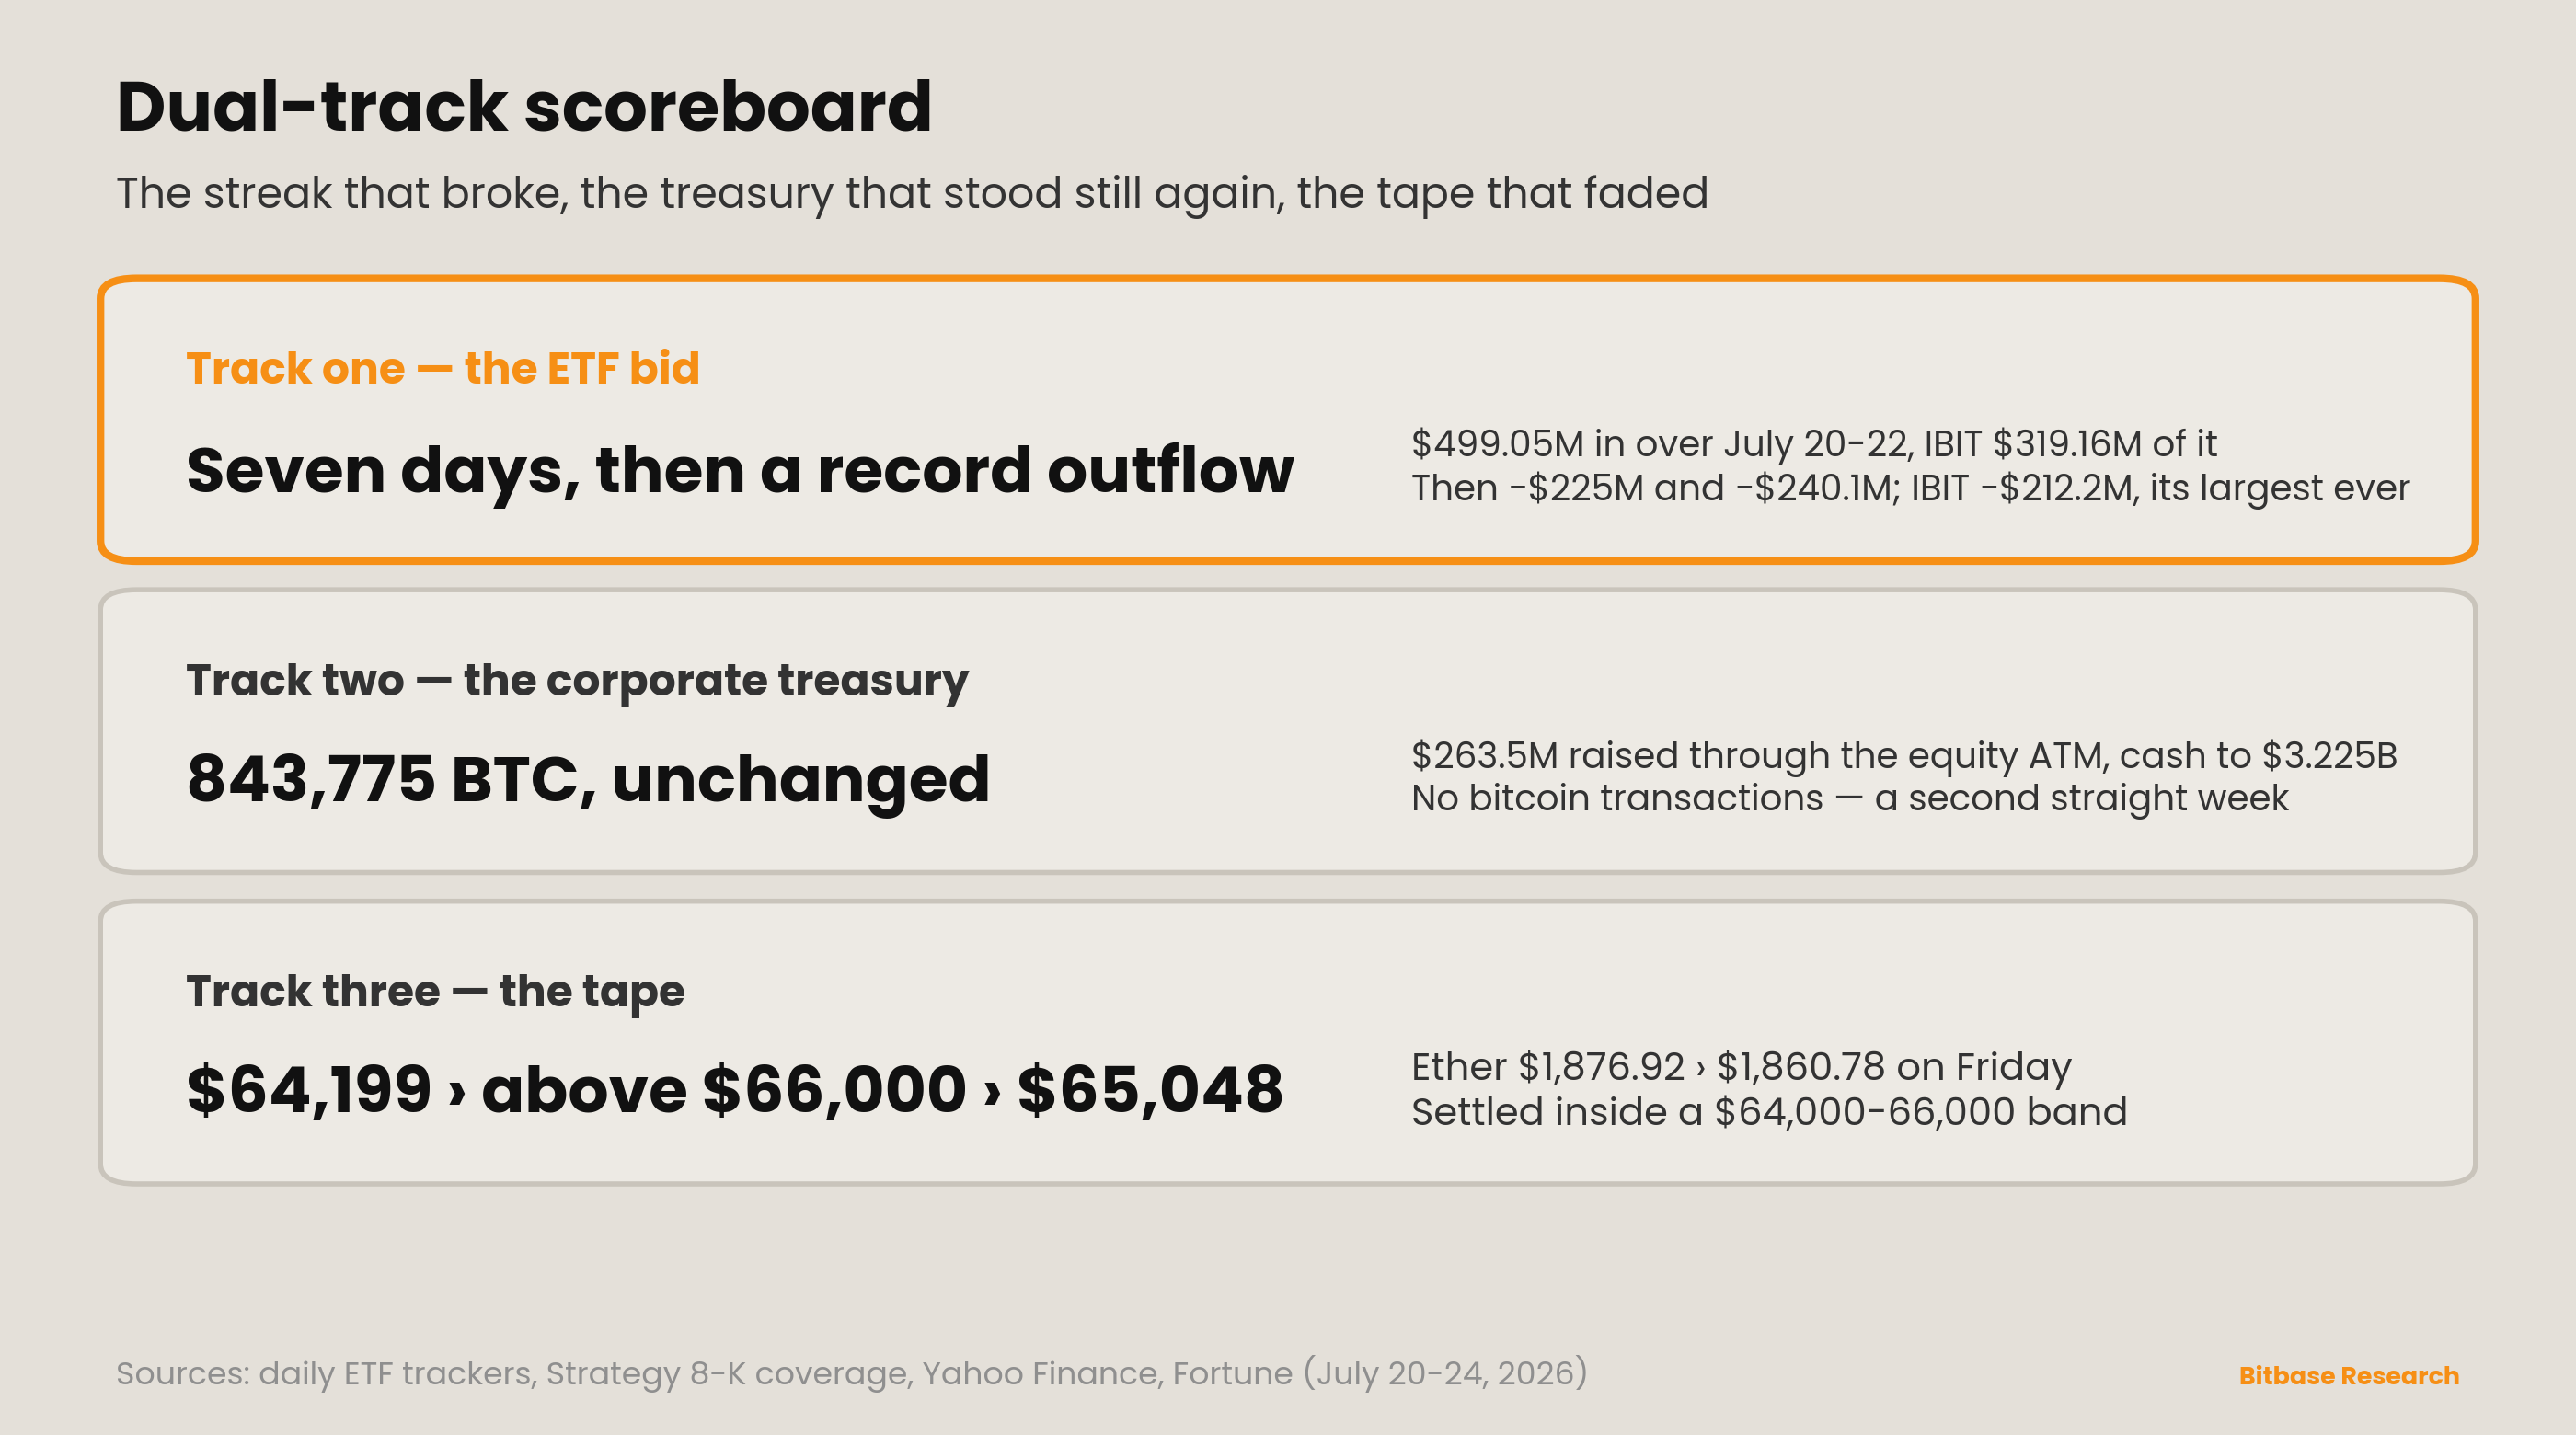
Track one—the ETF bid extended, then reversed hardest where it was most concentrated. Seven sessions, roughly $1 billion, 15% of June's losses recovered, IBIT at $319.16 million of this week's $499.05 million—then −$225 million and −$240.1 million on consecutive days, with IBIT's −$212.2 million setting a fund record [10][11][12]. Question answered: the bid sustained longer than four sessions, and its concentration cuts both ways.
Track two—the corporate treasury stood down for a second week. Issue 15 judged Strategy's late-June sale of 3,588 BTC to be event-driven rather than a policy shift, and said the next 8-K would test it. The filing covering July 13–19 repeats the pattern: the company sold about 2.73 million Class A shares through its ATM for roughly $263.5 million in net proceeds, lifted cash to $3.225 billion, and recorded no bitcoin transactions, leaving holdings unchanged at 843,775 BTC [14][15]. The position carries a cost basis of $75,476 per coin against $63.69 billion deployed [14]. Two consecutive weeks of the equity route confirms the read: the sale was event-driven. The $1.25 billion monetisation authorisation remains outstanding and unused.
Track three—the tape. Bitcoin opened the window at $64,199.13 on July 20, cleared $66,000 on the CLARITY news across July 20–21—the streak's two strongest sessions—then faded [10][16]. Friday July 24 opened at $65,047.87, 1.6% below Thursday's open, and settled inside a $64,000–66,000 band at the 16:00 UTC cutoff [13][17]. Ether opened Friday at $1,876.92 and eased to $1,860.78 by mid-morning [13]. Technically the market bounced off the 58K support zone but stayed short-term bearish; that framing is only invalidated on a hold above 67.5K [18].
On the radar—week of July 27 to August 2
The forward calendar stops being about anticipation this week, because the decision lands inside it.
First, the July 29 FOMC is no longer a forward item—it resolves in this window. The committee meets with hike odds at 38% as of July 24 and a July 25 snapshot showing roughly 61.3% hold against 36% for a quarter point [5][6]. Chair Warsh, who told Congress on July 14 that the inflation improvement was not "mission accomplished," now has an energy shock running against a soft core print [19]. The interesting outcome is not the decision but the language on oil: whether the committee treats the Hormuz shock as a relative-price event to look through, or as an inflation-expectations risk to lean against.
Second, does the money-fund drawdown reach three weeks? Two consecutive prints is the first thing in this series' tracking that looks like a series rather than an event. A third would make it very hard to keep calling the cash wall sticky. The July 29 ICI release is the test.
Third, does the ETF complex stabilise or extend the outflow? One record IBIT session does not undo seven days of inflows, but it does re-open the question Issue 15 thought had been answered. Watch whether the outflow is a two-day repricing around the FOMC or the start of a second June.
Fourth, the CLARITY Act enforcement fight. The bill's ethics language is agreed in principle; who enforces it is not. That single unresolved clause is what stands between the current draft and a floor vote.
Fifth, does oil hold above $90? Everything in section 1 is conditional on it. A Hormuz reopening would restore the June mechanism as fast as its closure removed it—and would make the rates repricing of the last nine sessions look like an overshoot in the other direction.
Signal tracking update
SIGNAL — Deep Dive 1 Part 1: "MMF asset scale inflection point." STATUS: SECOND DRAWDOWN—the series now has two datapoints.
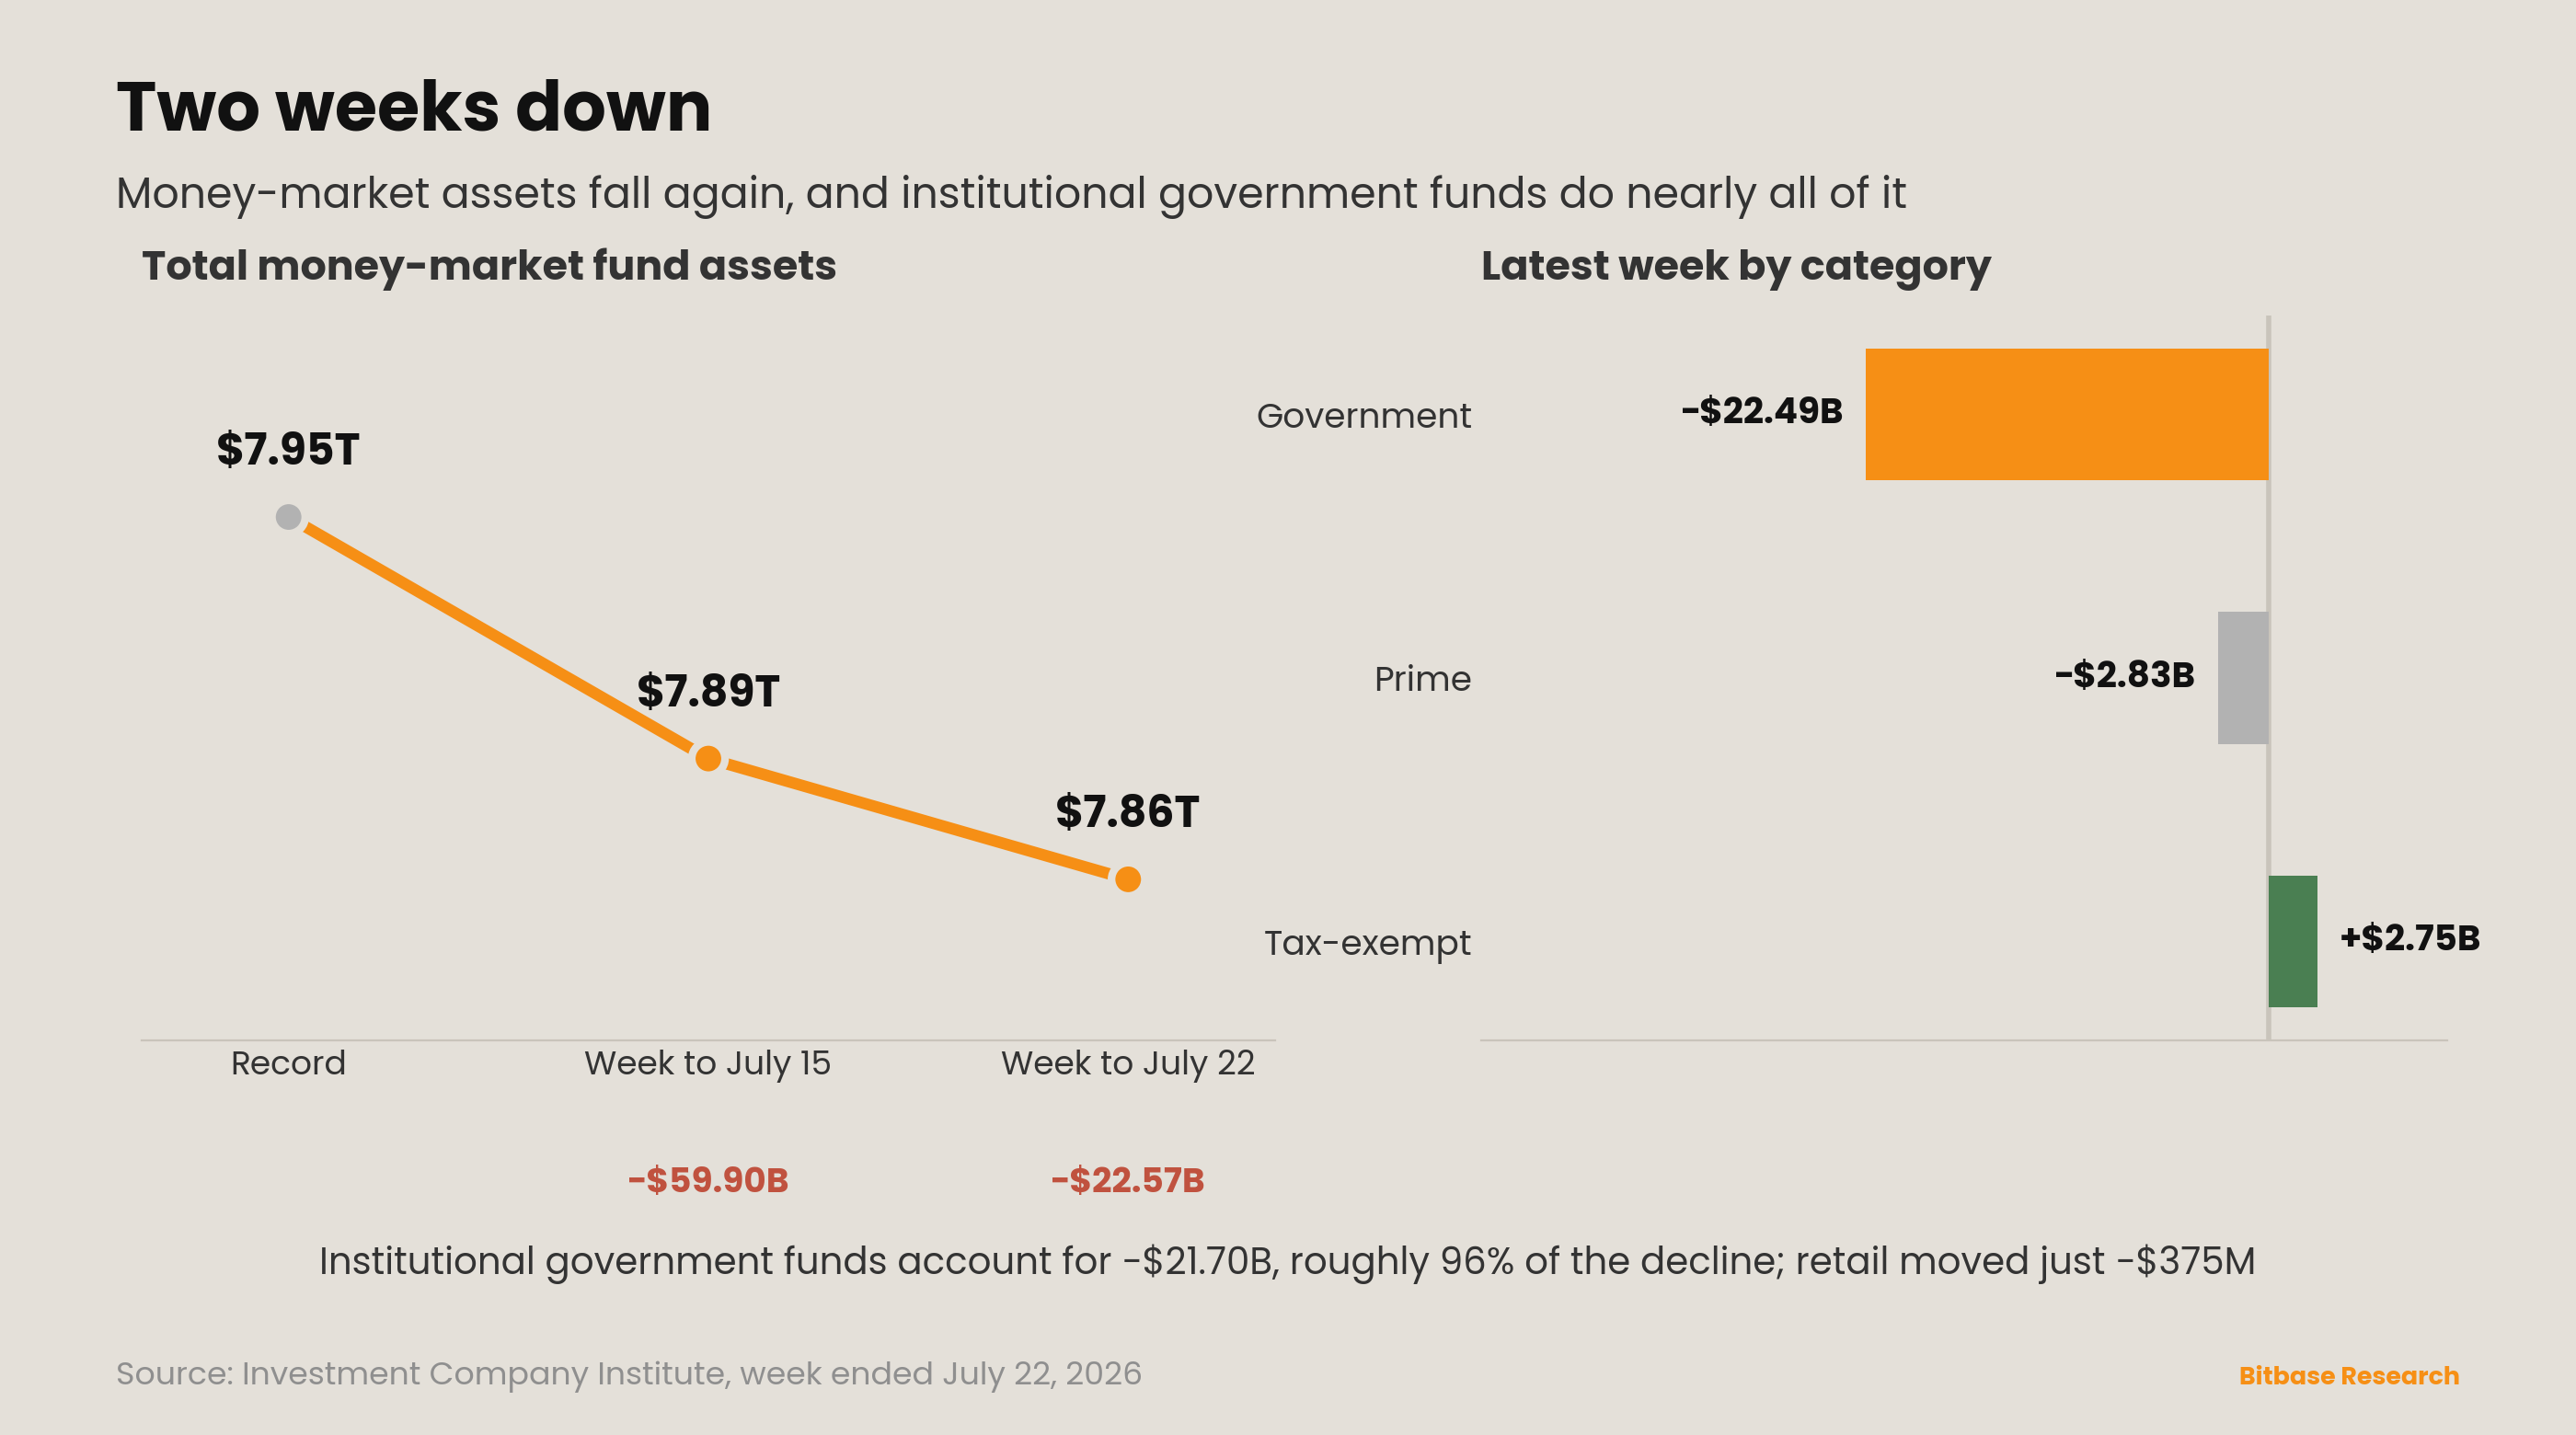
The follow-up Issue 15 asked for arrived on schedule. Per the Investment Company Institute, total money-market-fund assets fell $22.57 billion to $7.86 trillion for the week ended Wednesday, July 22 [9]. Combined with the prior week's −$59.90 billion, assets are down roughly $82.5 billion from the record $7.95 trillion, across two consecutive weeks.
The composition repeats almost exactly, which matters more than the size. Government funds fell $22.49 billion, prime fell $2.83 billion, and tax-exempt actually rose $2.75 billion [9]. Institutional assets dropped $22.19 billion to $4.78 trillion, with institutional government funds alone accounting for $21.70 billion—roughly 96% of the total decline [9]. Retail barely moved: −$375 million, leaving retail assets at $3.08 trillion [9]. The same fingerprint as last week: this is institutional government money leaving, not households reallocating.
Two readings, and the series should hold both. The constructive one is that two consecutive drawdowns is no longer a single print that could be tax-date noise; the record has been broken and has stayed broken. The cautious one is that the magnitude collapsed—$22.6 billion against $59.9 billion—and that institutional government balances move on bill supply, settlement plumbing and quarter-end mechanics as much as on risk appetite. The inflection has a trend line now, but it is a two-point line with a decelerating slope, and the second point came in a week when risk assets finished lower. That last detail cuts against the simple rotation story: if cash were chasing risk, it picked a poor week to do it.
SIGNAL — Deep Dive 1 Part 6: "Whether CME crypto-derivatives open interest persistently holds above $30 billion by 2027." STATUS: On track; data gap persists.
No standalone Tier-1 read for this window. The gap has been open since Issue 10 and is carried, not closed.
SIGNAL — Deep Dive 1 Part 6: "Whether the US CFTC approves more licensed entities to offer perpetual-swap-style products." STATUS: First approval resolved; second name still outstanding.
Nothing moved in this window. The case-by-case review path the Commission set out remains the constraint, and whether it produces a second licensed venue or functions as a moat around the first mover is still the open question.
SIGNAL — Deep Dive 1 Parts 3 and 6: "Tokenized RWA as common collateral infrastructure." STATUS: Live; full platform launch still scheduled for October.
The DTCC tokenization platform reported live in Issue 15 has no new disclosure in this window. October remains the date to watch.
New dimension—the market-structure bill got its deal, and kept its fight
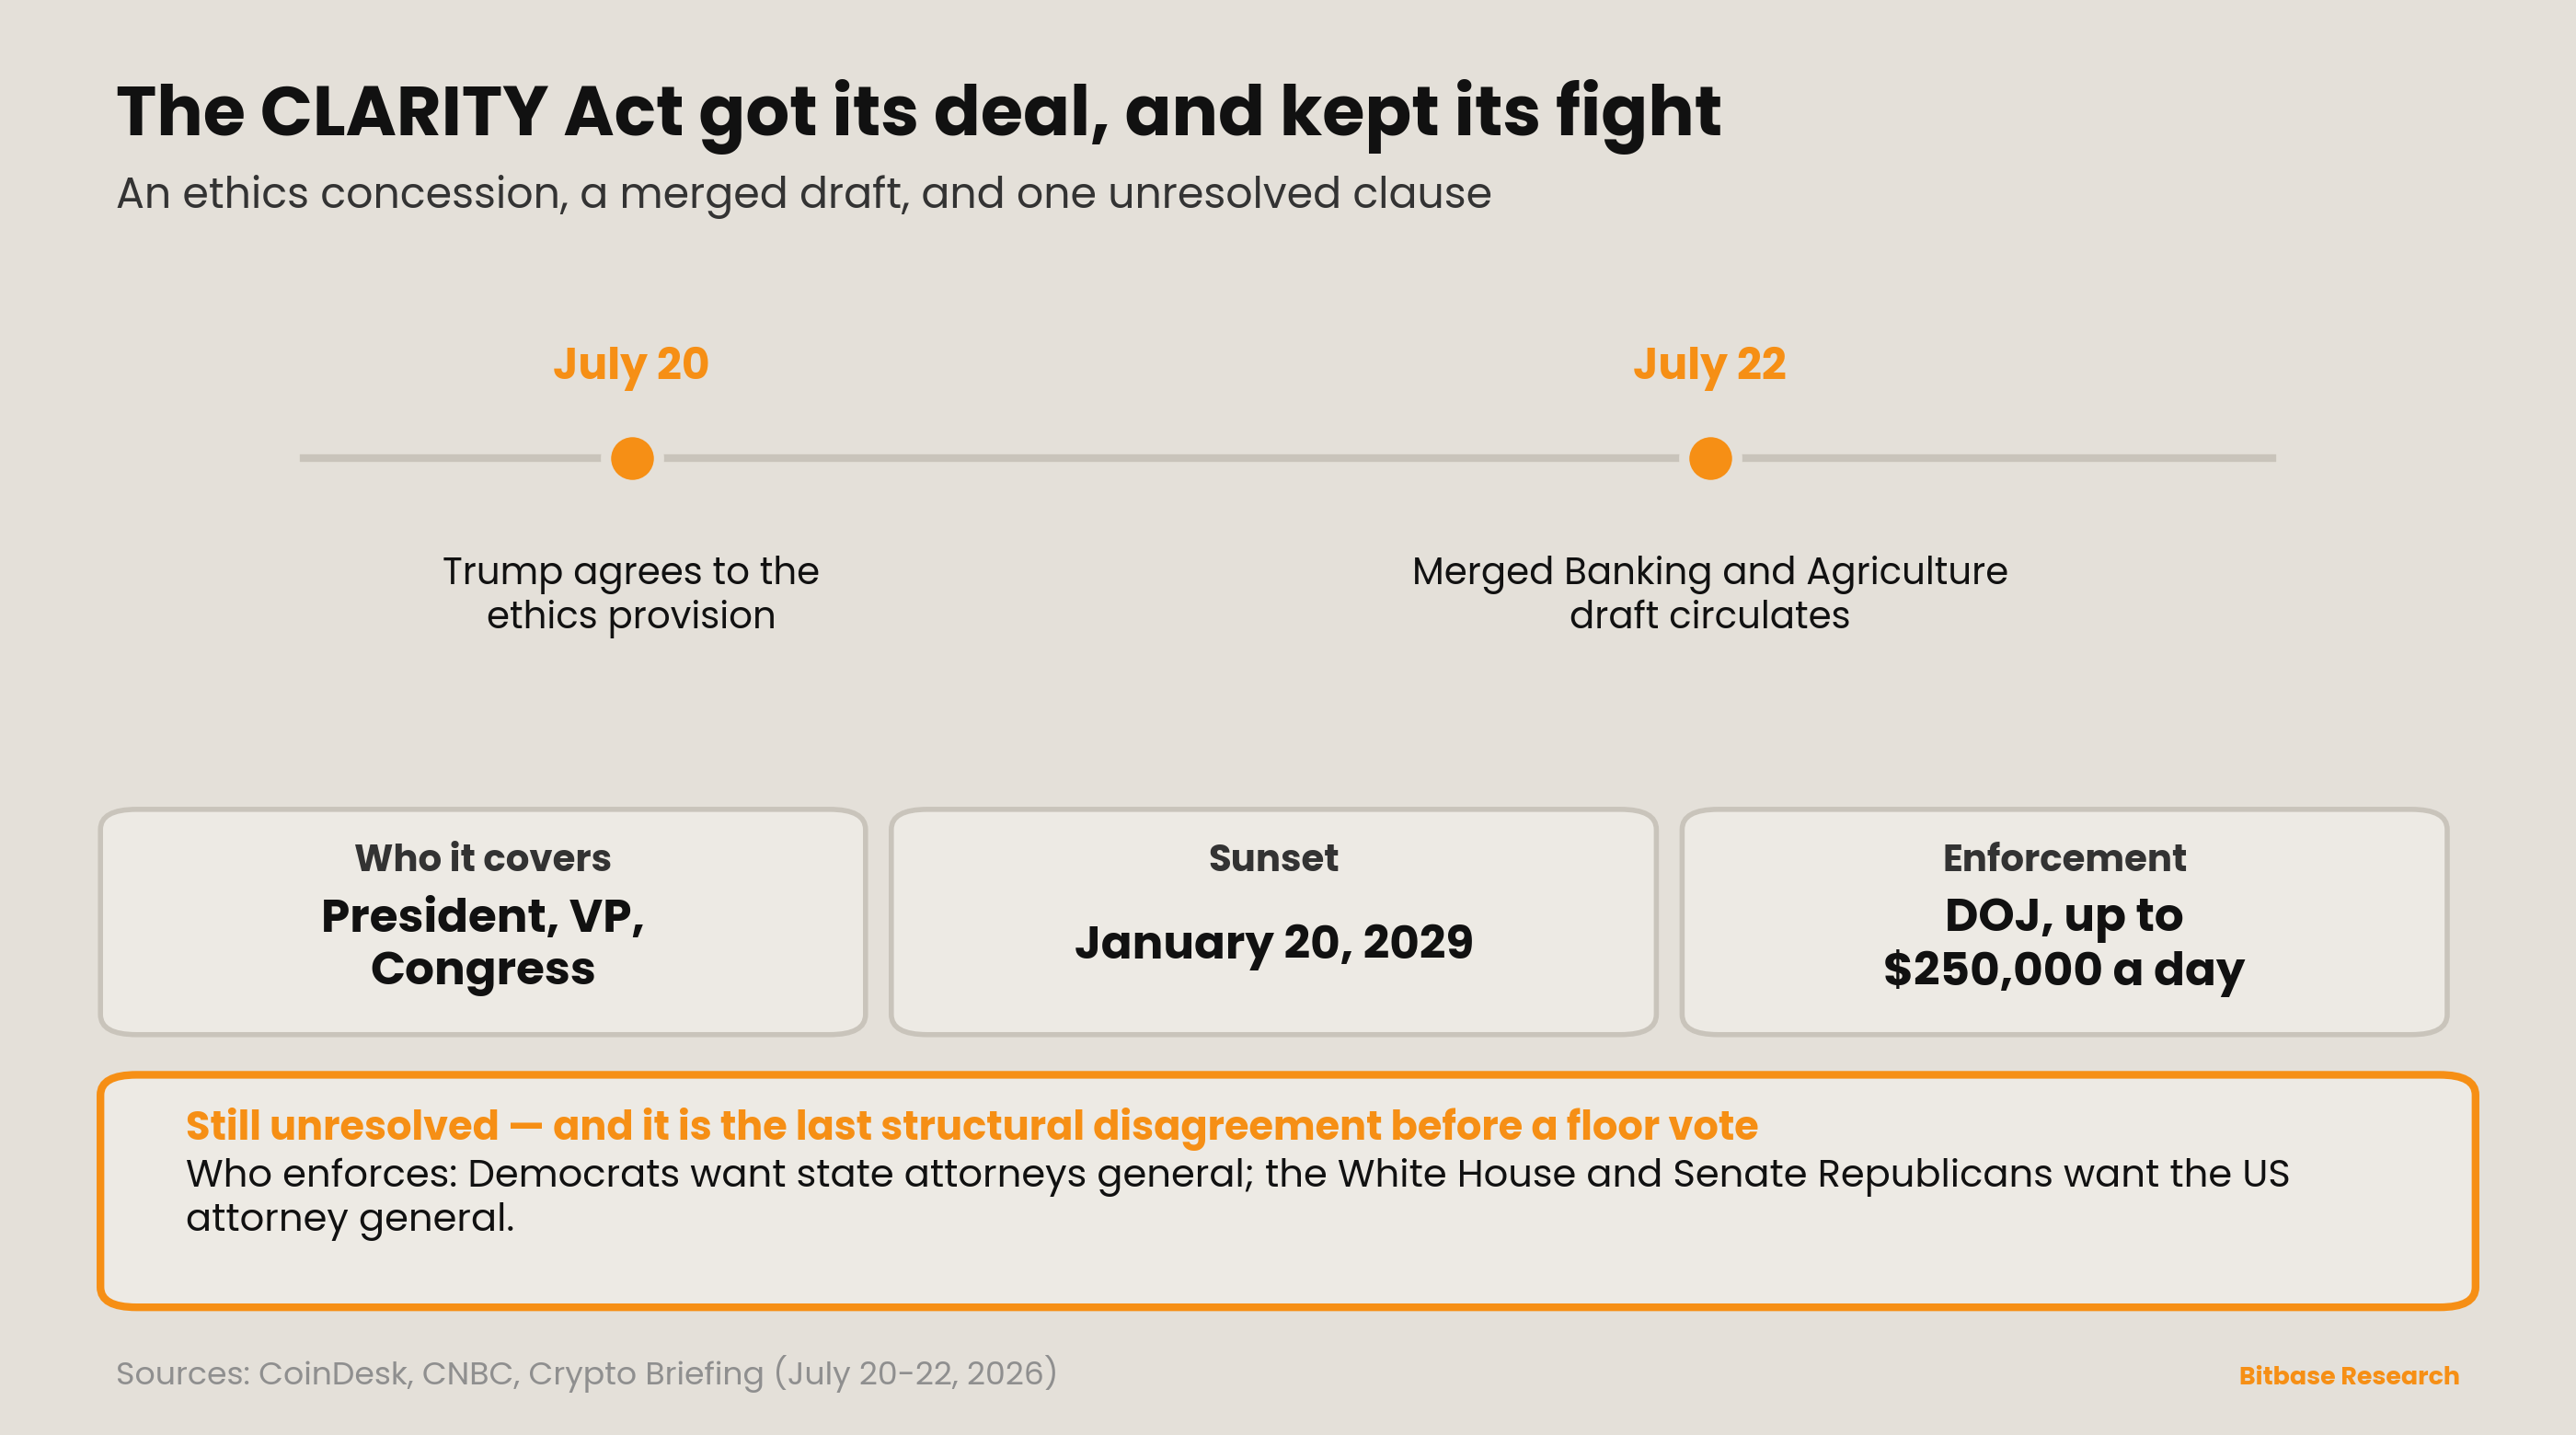
The week's regulatory news was not a rule but a concession. On the evening of July 20, President Trump agreed to the ethics provision that had been holding up the Digital Asset Market Clarity Act [20][21]. Two days later, on July 22, Senate Republicans circulated a new draft merging the versions passed by the Banking and Agriculture Committees into a single measure [22][23]. That sequence—concession first, merged text second—is why the market treated it as a genuine unblocking, and why bitcoin's two strongest sessions of the week were July 20 and 21 [10].
The terms are narrower than the headline suggests, and deliberately temporary. The provision bars federal officials—including the president, the vice president and members of Congress—from issuing or profiting from digital assets. But it carries a sunset of January 20, 2029 unless renewed, and enforcement runs through the Department of Justice, which may levy fines of up to $250,000 per day [21][23][24]. A time-limited ban enforced by the executive branch is a different instrument from a permanent one enforced independently.
And that is precisely the clause still unresolved. Democrats want state attorneys general empowered to enforce the restriction; the White House and Senate Republicans insist the US attorney general hold that authority [22][23]. The bill passed the House in summer 2025 and has cleared two Senate committees; the enforcement question is now the last structural disagreement between a draft and a floor vote.
Why this belongs in an issue about relief being withdrawn. The CLARITY news was the one genuinely constructive catalyst of the week, and it produced exactly two good sessions before macro took the tape back. That ratio is the lesson. Market-structure clarity is a durable, slow-compounding positive for the asset class; an oil shock is a fast, blunt negative. In a week that contained both, the fast one won, and it was not close. Regulatory progress sets the ceiling over quarters. Energy and the front end set the price this week.
Caveats
Date integrity. This issue's window is July 20–26, 2026. The CLARITY ethics agreement (July 20), the merged Senate draft (July 22), the ICI money-fund week ended July 22, the ETF flow prints (July 20–24), the Strategy 8-K covering July 13–19, and the oil and yield closes (July 24) all fall inside it. The July 29 FOMC, the July 29 ICI print and July CPI fall after this window and are treated as forward items, not results.
Verification status. The load-bearing figures—the ICI drawdown and its full composition; the daily ETF flows and IBIT's share, including the record outflow; Strategy's share sale, cash position and unchanged holdings; the oil close and weekly change; the 2-year and dollar-index closes; and the CLARITY Act terms—have been traced to primary or named Tier-1 sources.
Data-caliber conflicts and gaps flagged. July hike odds are carried with their snapshot dates because the published figures differ: 38% on July 24 and, on a July 25 snapshot, roughly 61.3% hold against 36% for a quarter point [5][6]. These are different moments rather than inconsistent readings of one moment, and neither is treated as authoritative for the other. The 2-year yield appears as both 4.33% and 4.34% in July 24 snapshots; the lower figure is carried and described as approximate [7]. The Hormuz transit count is from PortWatch's most recent published day, July 19, not from July 24, so the 83% reduction is accurate as of that date and is explicitly not asserted as a same-day reading [3]. Two crude benchmarks are carried separately and must not be read as one series: Brent supplies the intraweek move above $100 and the roughly 4% Friday decline to about $97, while WTI supplies the $89.87 Friday settlement, the 2.52% daily fall and the +8.9% weekly change [1][2]. Same-day intraday snapshots from one data provider put the weekly gain at both roughly 8% and roughly 10%; the settlement-based 8.9% from the wire coverage is the figure carried, and the intraday variants are not. No single Tier-1 source publishes one authoritative weekly ETF total, so daily figures are drawn from named trackers and remain subject to T+1 revision; the roughly $1 billion over seven sessions and the 15% recovery share come from the same reporting and are quoted together [10]. The 96% institutional-government share of the drawdown is arithmetic from ICI's published category splits, not a stated ICI finding [9]. Bitcoin and ether weekend prints for July 25–26 are not asserted; the tape is carried to the July 24 session. CME crypto open interest again has no standalone Tier-1 read, and that gap has been outstanding since Issue 10.
Source attribution. Oil levels and the dollar index are from named market-data providers; Treasury yields from a dated snapshot; money-fund assets from the Investment Company Institute's weekly release; ETF flows from named financial outlets and daily trackers rather than issuer disclosures, and therefore subject to revision; Strategy's share sale, cash and holdings from its 8-K as reported by named outlets; and the CLARITY Act terms from named coverage of a circulating draft rather than an enrolled bill, so those terms may change before any floor vote.
Causation discipline. The central claim of this issue—that oil reversed the mechanism behind June's disinflation and dragged the rates market with it—is a reading of sequence and composition, not a forecast; a Hormuz reopening would restore the June mechanism as quickly as its closure removed it. The link drawn between Friday's higher Treasury yields and the crypto retreat follows the attribution in the cited reporting, not an independent finding. The two-week money-fund drawdown is presented as a two-point line with a decelerating slope, not an established rotation. Nothing here is investment advice.
Related reading
Other Bitbase articles on this topic:
Disclaimer: This article is market commentary from Bitbase Research, provided for information only. The views are those of Bitbase Research as of the date of writing and do not constitute investment, trading, tax, or financial advice, nor an offer or solicitation to trade. Data in this issue is current as of July 26, 2026; markets and disclosures may change, so refer to the latest information from authoritative sources. Trading crypto assets and leveraged products carries significant risk, including the possible loss of your capital.
References
[1] Oil futures dip but surge for the week amid attacks on shipping routes; WTI settles at $89.87, down 2.52%, up 8.9% for the week, July 24, 2026. finance.yahoo.com
[2] Brent oil set for a weekly jump after topping $100 on supply fears, July 24, 2026. bloomberg.com
[3] Strait of Hormuz transit status, PortWatch data through July 19, 2026. straits.live
[4] Oil Market Report, July 2026. iea.org
[5] Fed rate hike odds rise to 38% ahead of the July meeting as oil prices fuel inflation fears, July 24, 2026. hngn.com
[6] Markets price in rising odds of a July Fed rate hike, July 23, 2026. forbes.com
[7] Treasury yields snapshot, July 24, 2026 (2-year 4.33%, 10-year 4.69%). advisorperspectives.com
[8] US Dollar Index close, July 24, 2026 (101.46, near a one-month high). tradingeconomics.com
[9] Investment Company Institute, weekly money-market fund assets, week ended July 22, 2026. ici.org
[10] BlackRock's IBIT leads a nearly $1B Bitcoin ETF recovery as inflows hit seven straight days, July 2026. finance.yahoo.com
[11] Seven straight Bitcoin ETF inflow days recover just 15% of June's losses, July 25, 2026. finance.yahoo.com
[12] US spot-Bitcoin ETFs see $240.08 million in net outflows, July 24, 2026. en.bloomingbit.io
[13] Bitcoin and ethereum prices, Friday July 24, 2026: crypto prices retreat on higher US Treasury yields. finance.yahoo.com
[14] Strategy bitcoin holdings stay at 843,775 BTC after a $263.5M raise, July 2026 8-K. crypto.news
[15] Strategy sells $263.5M in MSTR shares and skips bitcoin again, July 2026. thedefiant.io
[16] Current price of Bitcoin for July 20, 2026. fortune.com
[17] Current price of Bitcoin for July 24, 2026. fortune.com
[18] BTC weekly outlook, July 20–26, 2026. ventureburn.com
[19] Takeaways from Fed Chairman Kevin Warsh's congressional testimony, July 14, 2026. cnn.com
[20] Trump agrees to crypto ethics rules in the CLARITY Act, July 2026. cryptobriefing.com
[21] CLARITY Act: Trump signs off on ethics language, July 21, 2026. disruptionbanking.com
[22] Crypto CLARITY Act still at the mercy of its ethics section as Democrats balk at the Trump deal, July 21, 2026. coindesk.com
[23] A new CLARITY Act emerges that makes the ethics rule temporary, July 22, 2026. coindesk.com
[24] Senate crypto bill would ban federal officials from issuing digital assets, July 22, 2026. cnbc.com