

Bitcoin price has fallen below $82,000 following a hotter-than-expected U.S. inflation report, while its daily chart still places the Supertrend support line below the market near $79,664.
Summary
- Bitcoin price traded near $81,900 after retreating from a daily high above $84,100.
- U.S. annual inflation rose to 3.7% in September, exceeding the 3.6% forecast.
- Daily Supertrend stood at $79,663.52, while Aroon readings favored recent downward price action.
- Lennart Snyder outlined downside targets at $81,400 and $80,300 after shorting near $82,800.
TradingView’s Binance BTC/USDT daily chart showed Bitcoin at $81,830.60 on Oct. 14, down 1.61% from the session’s opening price of $83,169.01. The session ranged between $81,588.88 and $84,146.72, placing Bitcoin close to its daily low.
The weekly chart, recorded a minute later, showed a price of $81,910.01 and a decline of 2.22% from the weekly opening level. Both timeframes placed Bitcoin below $82,000 after its latest attempt to hold above $84,000.
U.S. inflation rises as Bitcoin retreats from $84,000
The Bureau of Labor Statistics reported that consumer prices increased 0.6% in September, following a 0.4% increase in August. Annual headline inflation reached 3.7%, up from 3.4% a month earlier.
The agency said gasoline prices rose 9.1% during September and accounted for more than half of the monthly increase. Core prices, which exclude food and energy, rose 0.3% over the month and 2.6% over the year.
The headline reading exceeded economists’ 3.6% forecast. As per CME FedWatch, the probability of an October interest rate increase was roughly 44%–49% after the release, compared with 22% beforehand.
The same report placed the two-year Treasury yield near 4.9% and the 10-year yield around 5.3%. The publication also reported declines in U.S. stocks, with the S&P 500 losing 0.6% and the Nasdaq falling 0.8%.
Trader Lennart Snyder linked Bitcoin’s decline to the inflation release in his Oct. 14 market commentary. He described the data as favorable for the dollar and said he opened a short position near $82,800 after the 9:30 a.m. market opening.
Daily Supertrend remains below Bitcoin at $79,664
TradingView’s daily chart placed the Supertrend line at $79,663.52, with its green line remaining below Bitcoin’s price. At $81,830.60, Bitcoin was about $2,167, or 2.7%, above that indicator level.
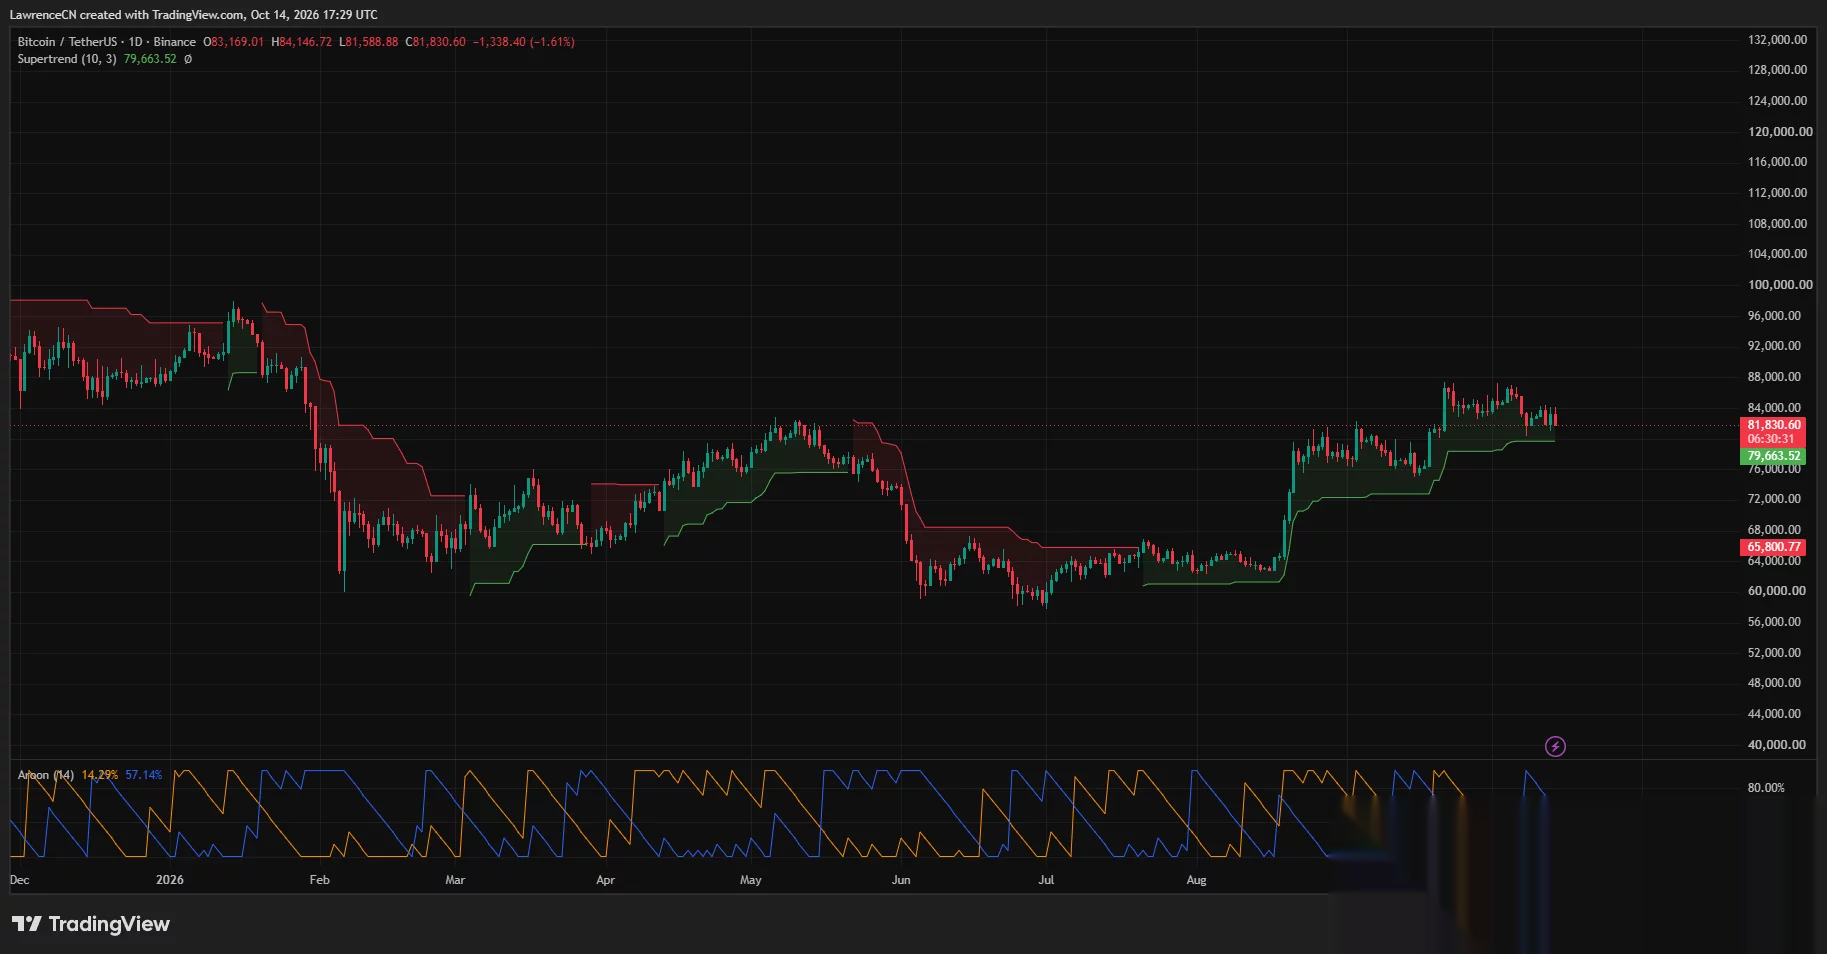
The chart showed a strong advance from the low-$60,000 region in August, followed by trading in the upper-$70,000 range through much of September. A later move carried Bitcoin toward $87,000 before the latest retreat into the low-$80,000 range.
The daily Aroon readings were less favorable than the Supertrend position. Aroon Up stood at 14.29%, while Aroon Down was 57.14%, showing that the latest 14-period low was more recent than the latest high.
Together, the displayed indicators presented a mixed setup: Bitcoin remained above its daily Supertrend line, while Aroon Down exceeded Aroon Up by 42.85 percentage points. The price decline had narrowed the distance to the green support line without crossing it.
The daily session high of $84,146.72 also sat within the resistance area identified by Snyder. He said repeated rejections around $84,000 supported his decision to take a short position.
Snyder targets $80,300 and waits for a stronger recovery
Snyder identified $81,400 and $80,300 as the first downside targets for his position. His commentary also outlined a possible short entry if Bitcoin bounced from around $82,000 and retested approximately $83,000, provided his trading trigger appeared.
The trader said he preferred a forceful break above $84,000 or a move below $80,000 before considering more attractive long positions.
“I find longs less attractive at the moment, I prefer to break 84K with strength or going below 80K for quality longs again.”
Snyder’s broader downside plan extended to approximately $77,000 if Bitcoin lost $80,000. He described that level as his final take-profit area for a remaining portion of the short position.
TradingView’s weekly chart added a wider set of reference levels. Its Murrey Math indicator marked $75,000 as a strong pivot and $87,500 as the lower boundary of its labeled trading range.
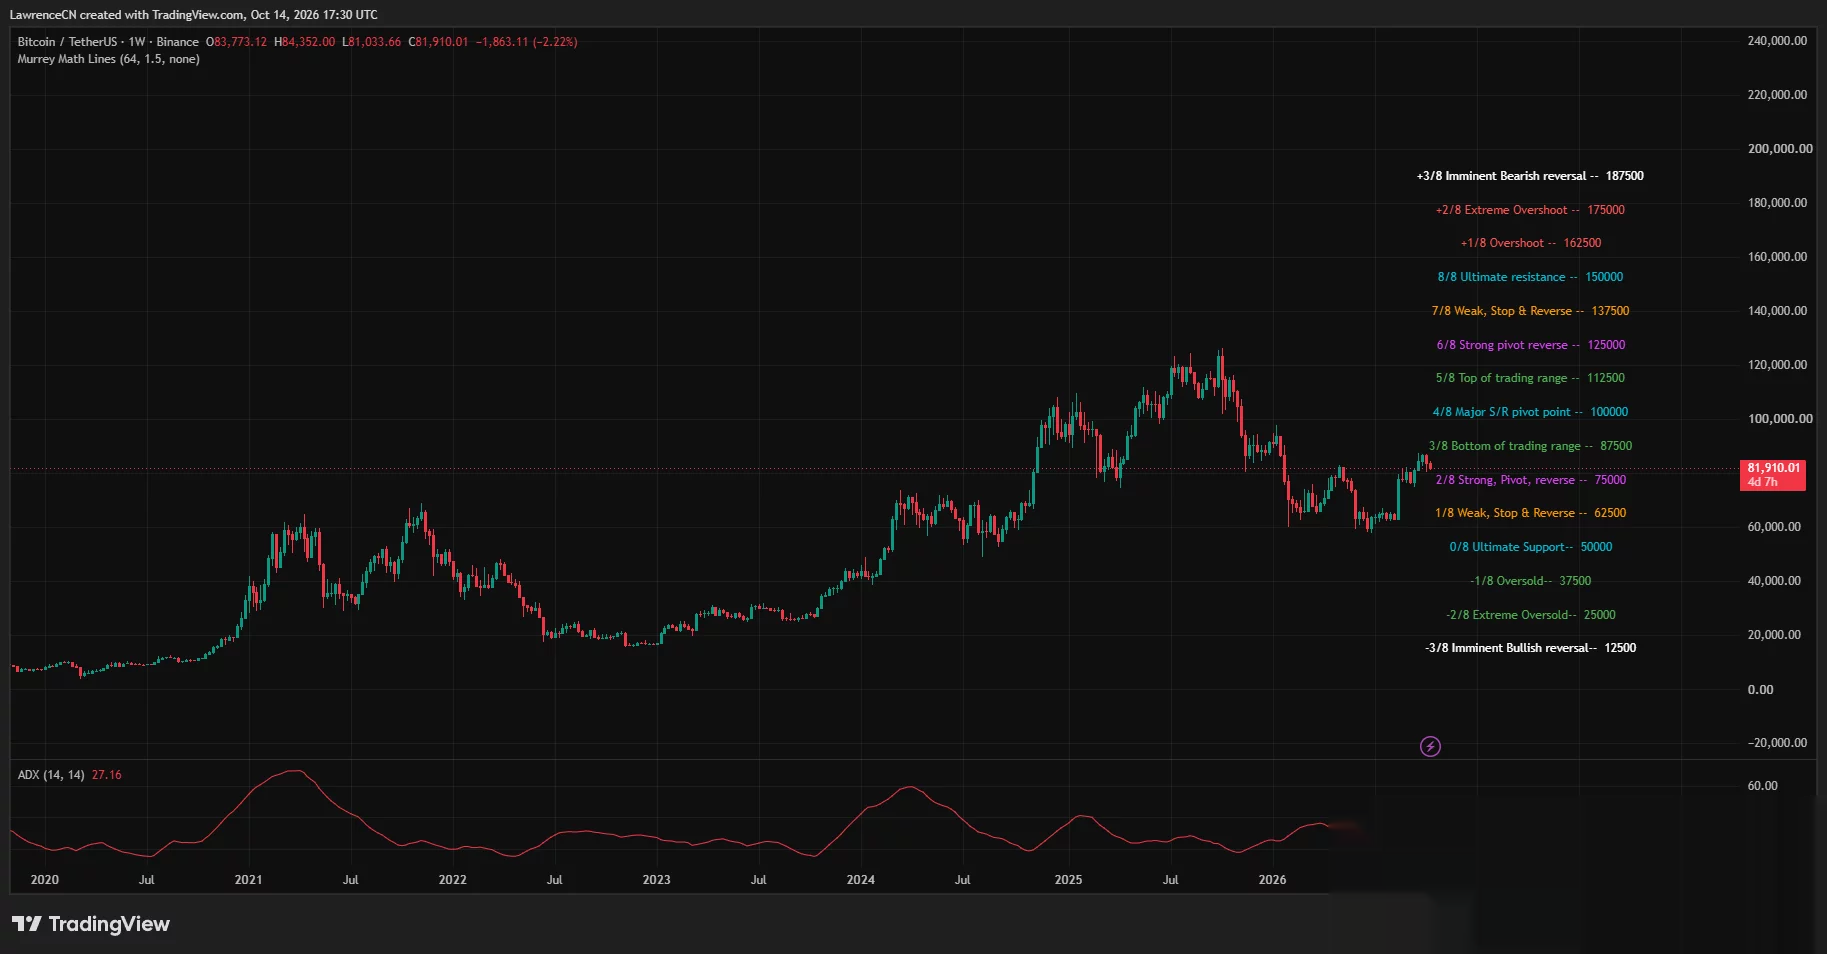
Bitcoin’s weekly price of $81,910.01 sat between those two levels, about 9.2% above $75,000 and 6.4% below $87,500. Weekly ADX stood at 27.16, while the weekly price range extended from $81,033.66 to $84,352.
Liquidation concentrations remain above $84,000
CoinGlass’s one-week liquidation heatmap showed its brightest nearby bands around $84,400–$84,700. Those concentrations sat above both the latest price and the $84,000 resistance area discussed by Snyder.
Lower on the heatmap, estimated liquidation bands appeared around $81,500, $81,000, and $80,300–$80,500, with further concentrations near $79,700–$80,000. The price trace showed earlier sharp declines toward $80,300 and $81,000 before rebounds.
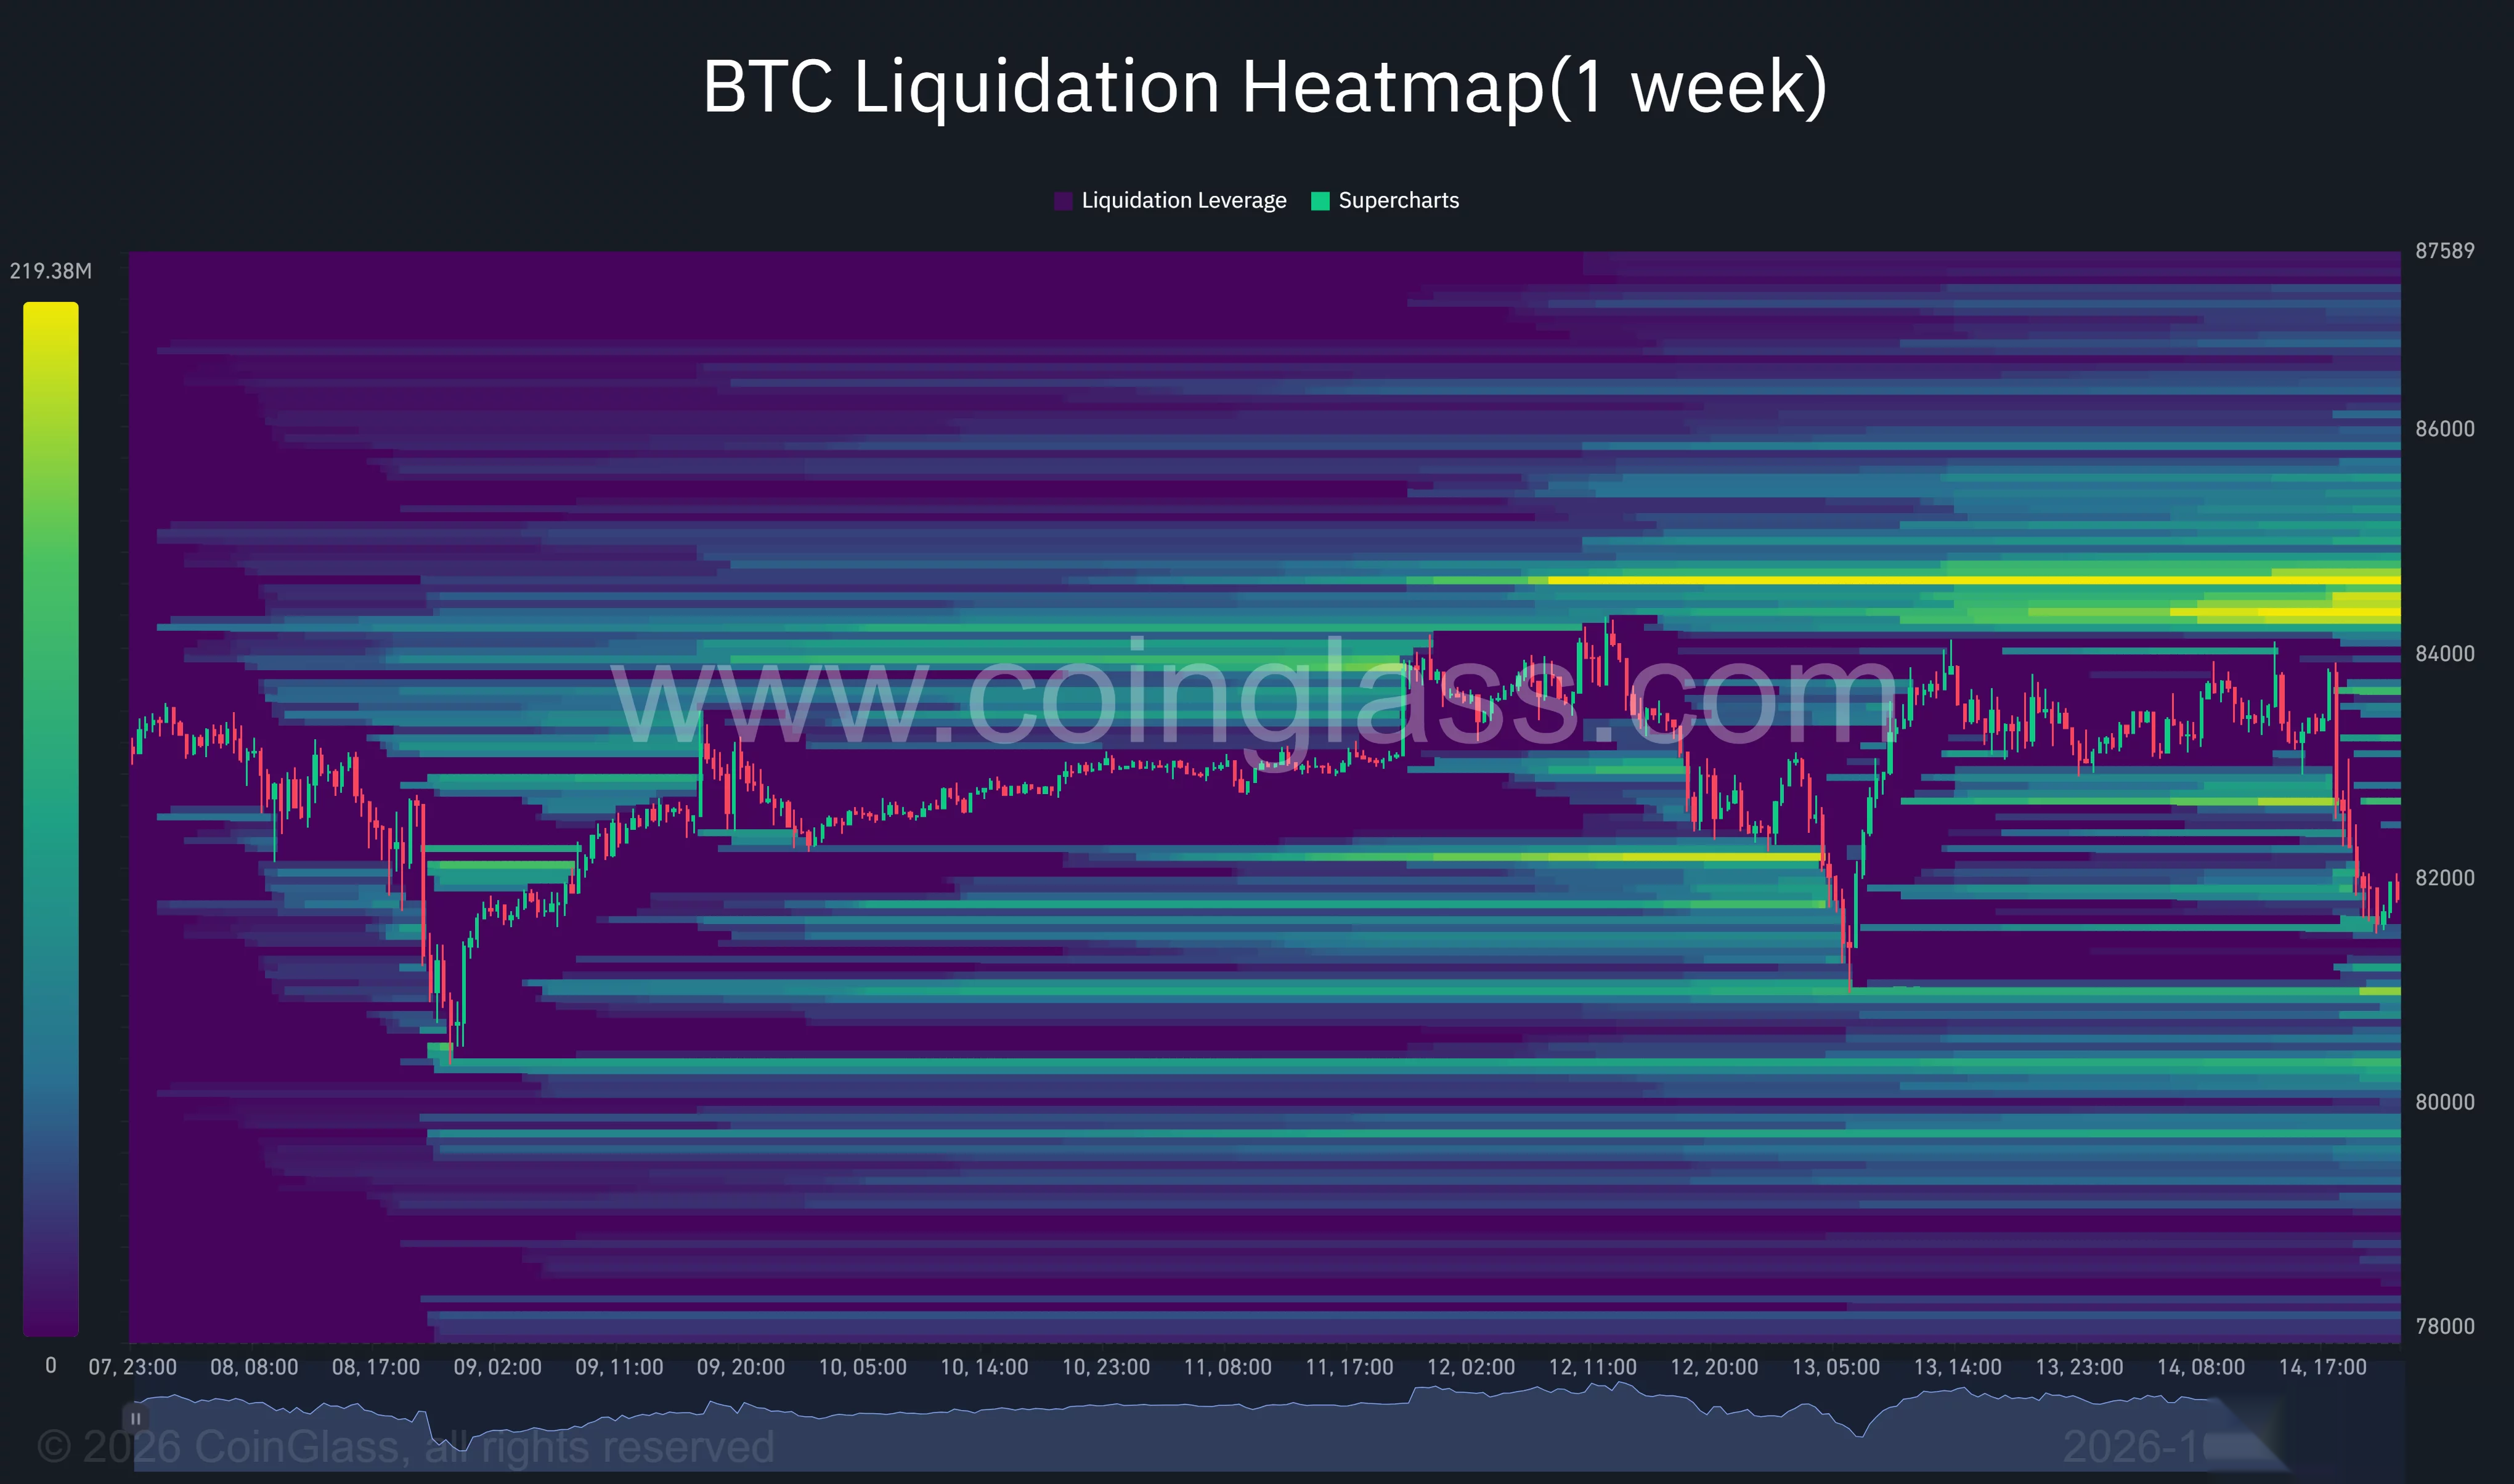
The latest decline returned Bitcoin to the upper-$81,000 region, below much of the range traded earlier on Oct. 14. CoinGlass’s overhead bands remained brighter than the nearby lower bands at the right edge of the heatmap.
Snyder’s $80,300 downside target therefore sat close to a lower concentration visible on CoinGlass, while his preferred $84,000 recovery threshold remained below the brightest overhead cluster. His outlook left both a recovery trade and further downside conditional on Bitcoin’s response at those levels.