

In brief
- August core PCE rose 3.0% year over year against 3.3% expected, and headline PCE came in at 3.4% versus 3.7%. October rate-hike odds now sit at 34.9%.
- Bitcoin popped above $85,000 to a high of $85,598.94, then eased to $84,376, up 0.9%. That's still inside the range it has held since its September surge.
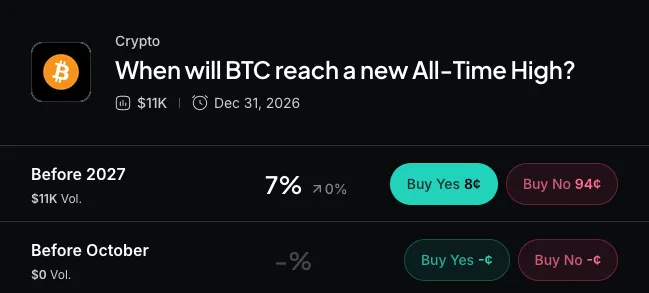
- On Myriad, traders put just 7% odds on Bitcoin topping its $126,199 all-time high before 2027, and ETF inflows have faded since their $2.4 billion week.
Bitcoin is doing something Wall Street can't right now: staying calm.
The Federal Reserve's preferred inflation gauge, the PCE index, rose 0.3% in August and 3.4% from a year earlier, below the 0.4% and 3.7% economists expected. Core PCE, which strips out volatile food and energy prices, rose 0.2% on the month and 3.0% annually, against forecasts of 0.3% and 3.3%.
Bitcoin reacted, pushing above $85,000 to a high of $85,598.94 before easing back to $84,376.09. The total market capitalization of the crypto ecosystem is up a bit, 0.6%, just below $3 trillion.
The PCE numbers change the October conversation. CME's FedWatch tool now shows a 62% chance the Fed holds rates and a 37% chance of a 25-basis-point hike.
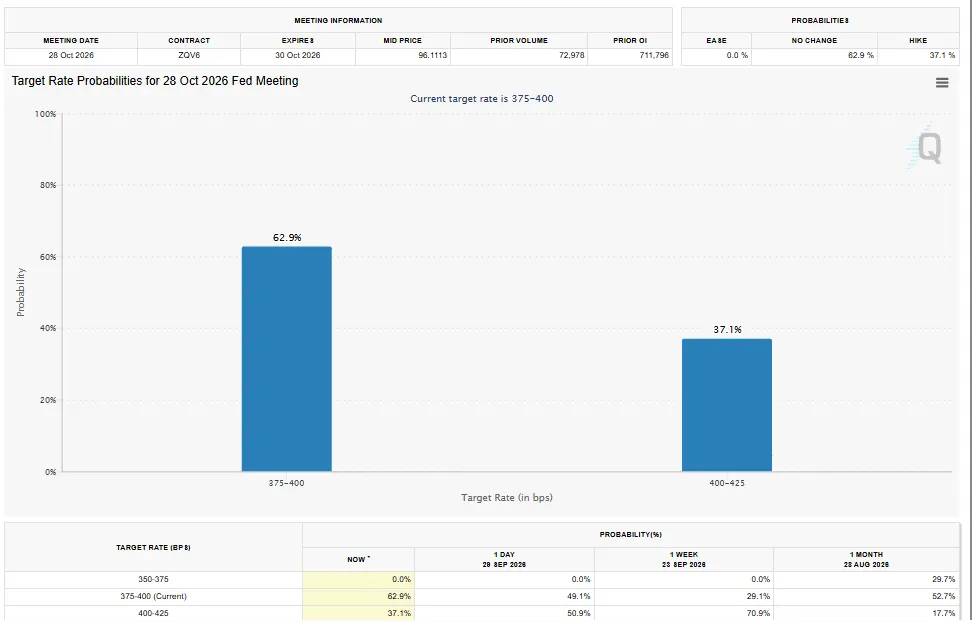
Hike bets had already been fading of late, which bodes well for risk assets. A rate hike means higher borrowing costs across the economy, and it typically strengthens the dollar while lifting returns on cash and government bonds. Lower rates tend to increase market liquidity, which typically means more money flowing into investments like Bitcoin.
Cool is relative, though: 3.0% core inflation is still well above the Fed's 2% target.
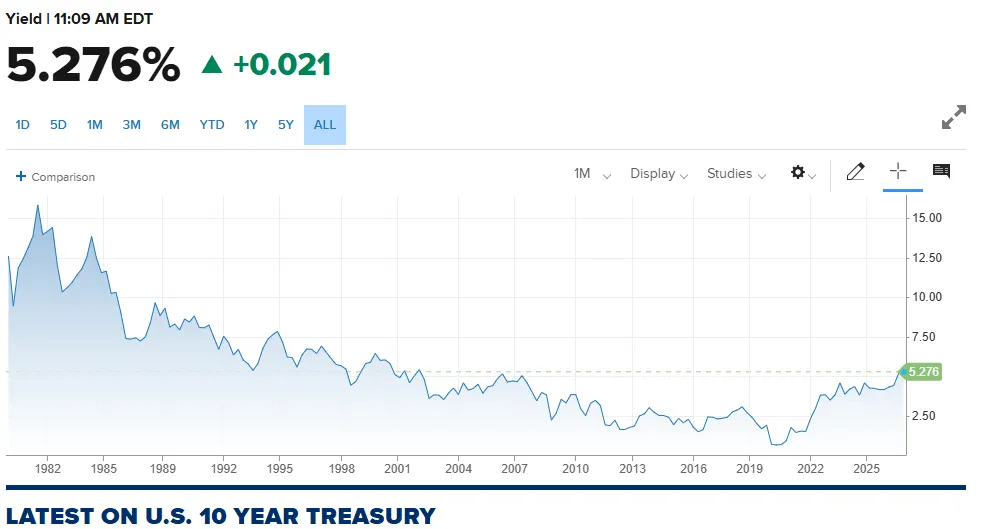
The 10-year Treasury yield hit around 5.25% on Tuesday, its highest level since 2002. The S&P 500 lost 0.2% to 7,670.84, the Dow Jones fell 0.3% and the Nasdaq slipped 0.1%. Brent crude briefly topped $100 on Monday before easing to $96.16 as the U.S.-Iran conflict keeps disrupting shipments through the Strait of Hormuz. Consumer confidence hit a 12-year low, and August job openings came in at 7.08 million, below forecasts.
Even with Bitcoin proving strong, on Myriad, a prediction market built by Decrypt's parent company Dastan, traders aren't ready for a victory lap. The market asking when BTC will reach a new all-time high uses the previous record of $126,199.63 on Binance as the target. The odds of it happening before 2027 stand at just 7%. Bitcoin would need to climb about 50% in three months.
That said, traders are currently pricing in 49% odds that Bitcoin stays above $84,000 in the near term, with 21% odds it rises above $86,000 by Monday.
Bitcoin price: a rocket, then a breather
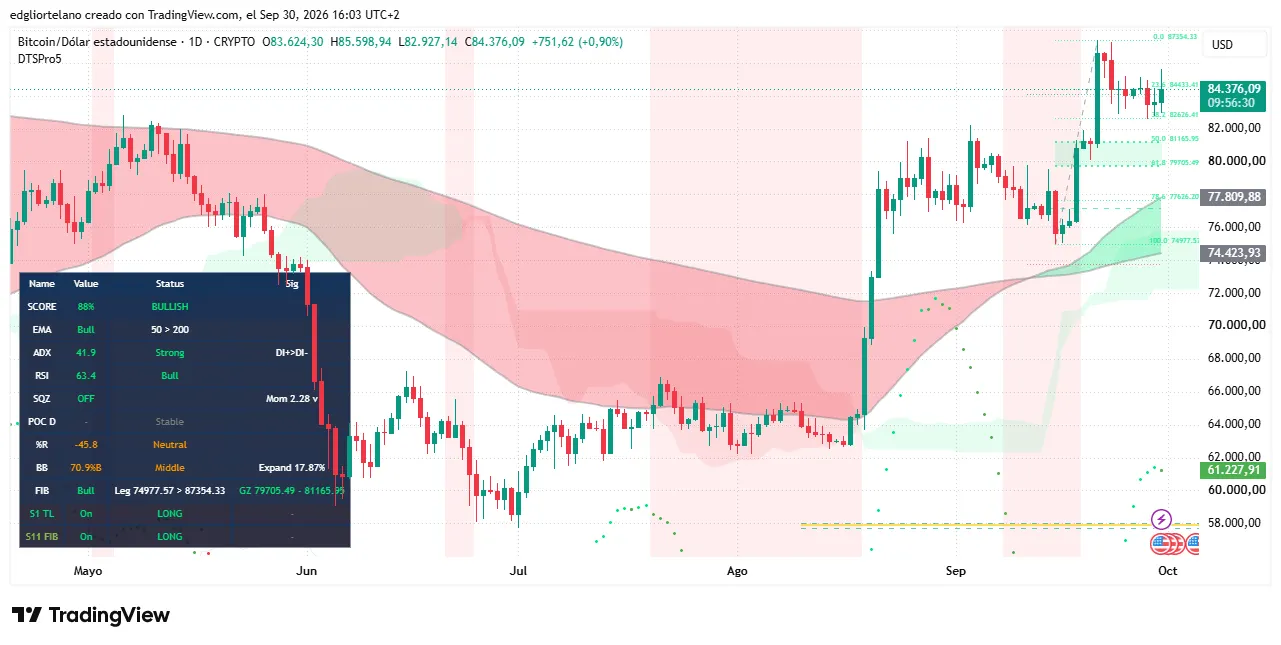
Today's daily candle opened at $83,624.30, touched a high of $85,598.94 and corrected to its current price of $84,376.09, up $751.62 or 0.9%.
That's a pause after a vertical run. Bitcoin dipped below the $75,000 line in mid-September, then exploded after a massive ETF inflow day on September 21, the biggest of 2026, and a wave of short liquidations sent it to $87,354, its highest price since January.
Over the past week it has bounced in a tight band between roughly $82,600 and $85,600.
The Average Directional Index, or ADX, measures how strong a trend is regardless of direction. Readings above 25 confirm a real trend, and BTC's 41.9 is a strong one, with the positive directional line above the negative one, meaning buyers are steering. The catch is that ADX lags. It's high because of the vertical move and can stay elevated even while price goes sideways, as it's doing now.
Exponential moving averages, or EMAs, track average prices while giving more weight to recent days. The 50-day EMA sits at $77,809.88, above the 200-day EMA at $74,423.93. When the shorter average is above the longer one, traders read the trend as bullish, and the ribbon on the chart flipped from red to green in September after BTC spent June through mid-August under the 200-day. Bitcoin’s current price is about 8% above the 50-day, which is a stretched gap. Traders often expect a retest of that average before the next leg.

BitcoinBTC · USD
$84,134+0.17%
Sep 23Sep 25Sep 27Sep 28Sep 30
$85.3k$84.4k$83.5k$82.7k
24h HighHigh$85,518
24h LowLow$82,911
VolVol$1.5B
Market projectionsOdds by Myriad
Today$84,000 to $86,000$84k–$86k97% chanceThis weekAbove $84,000Above $84k52% chanceThis month$84,000 to $86,000$84k–$86k97% chance
 →
→Buy Bitcoin with USDT
Powered by Jupiter
The Relative Strength Index, or RSI, gauges buying versus selling momentum on a 0-100 scale. Above 70 is considered overbought, and below 30 oversold. At 63.4, buyers are in control but not exhausted, which leaves room for more upside before profit-taking typically kicks in.
Overall, the technical picture leans bullish on trend and momentum but is stalling under $85,599. Traders would want daily closes above that level, and ideally above $87,354, with ADX staying north of 25 for confirmation.
The inflation scare is off the table for now. The bond market's problem isn't. Notably, the post-PCE pop stalled at $85,599, the same ceiling that has capped Bitcoin all week. Cool data gave bulls a catalyst, but not yet a breakout.
Disclaimer
The views and opinions expressed by the author are for informational purposes only and do not constitute financial, investment, or other advice.