






Written by: The DeFi Edge
Compiled by: Luffy, Foresight News
Bitcoin has been trading sideways for two months, but many DeFi tokens have not lain flat along with the broader market at all.
After Bitcoin surged 21% in August, it entered a range-bound oscillation. Starting from August 22, Bitcoin's daily closing price has consistently fluctuated back and forth between $75,600 and $86,600. During this period, Bitcoin rose 5.6% overall, while Ethereum instead fell 2.7%.
Among the 19 leading DeFi tokens we tracked that distribute dividends to token holders, 14 outperformed Bitcoin. Among them, Raydium rose 178%. The median gain of this batch of tokens reached 12.9%, more than twice Bitcoin's gain.
Why focus on "actual earnings distributed to holders"?
Looking only at total protocol revenue can be misleading. Some protocols earn a lot of money, but do not distribute a single cent to token holders; the earnings may ultimately be taken by the team.
Therefore, this article tracks "actual earnings distributed to holders": including token buyback and burn, fee burning, and earnings paid directly to token holders. This statistical scope comes from DeFiLlama.
To be included, a token must meet the following conditions:
- Only core DeFi projects are counted: DEXs, perpetual contracts, lending, collateralized debt positions, liquid staking, yield tools, and yield aggregators. Public chains, oracles, and launchpads are not within the scope (including Pons, etc.).
- As of August 22, market capitalization exceeded $100 million.
- In the past year, there has been a record of distributing earnings to token holders.
All tokens that meet the screening conditions are included in the statistics. For example, Raydium uses money earned from its Launchpad business to buy back tokens, and Hyperliquid directly burns fees; both types count as actual earnings distributed to token holders.
The statistical period is from August 22 to October 20, compared with the previous 59 days of data. Price source is CoinGecko, and 19 tokens were ultimately selected.
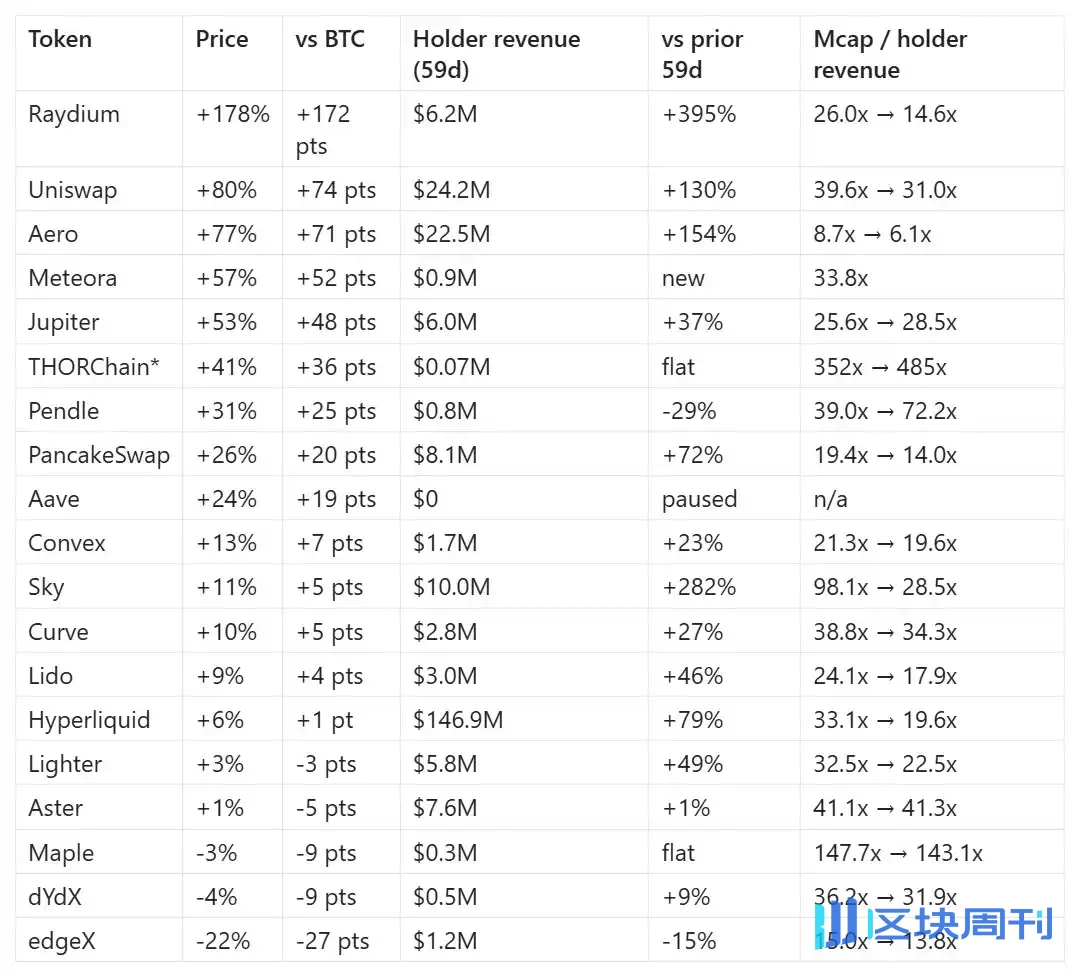
In the table, "market cap / holder annualized earnings" refers to dividing total market capitalization by all earnings distributed to holders over one year at the current earnings level. The lower the value, the lower the cost investors pay for each dollar of dividends.
Which tokens performed best?
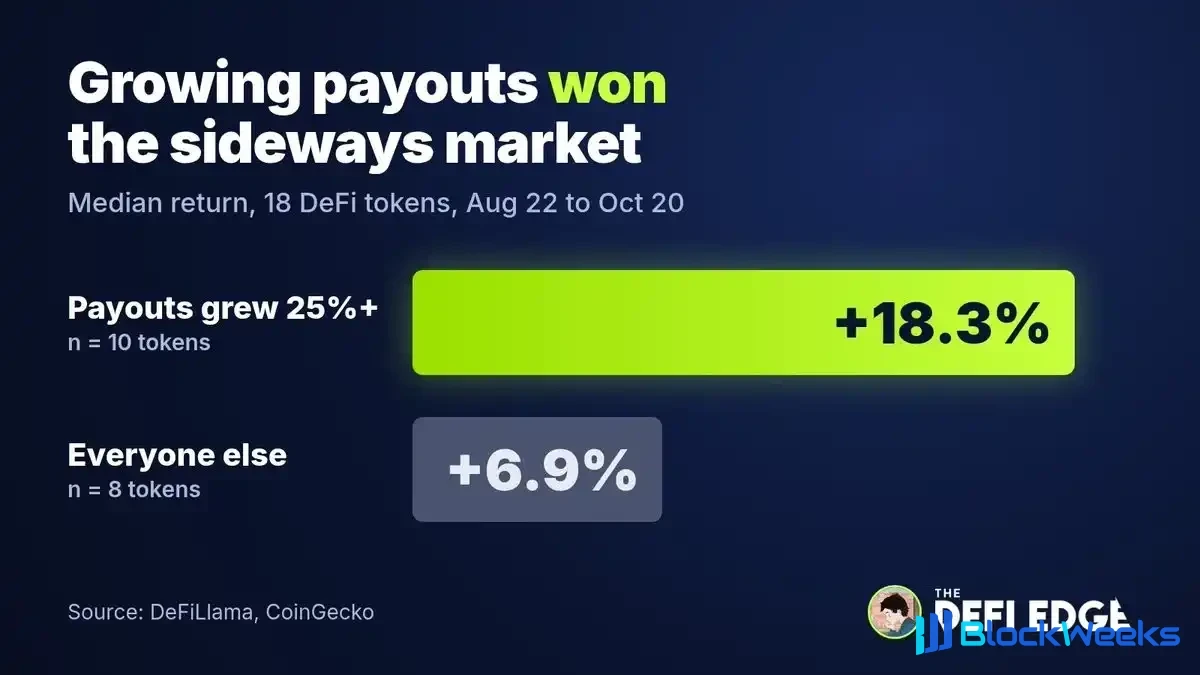
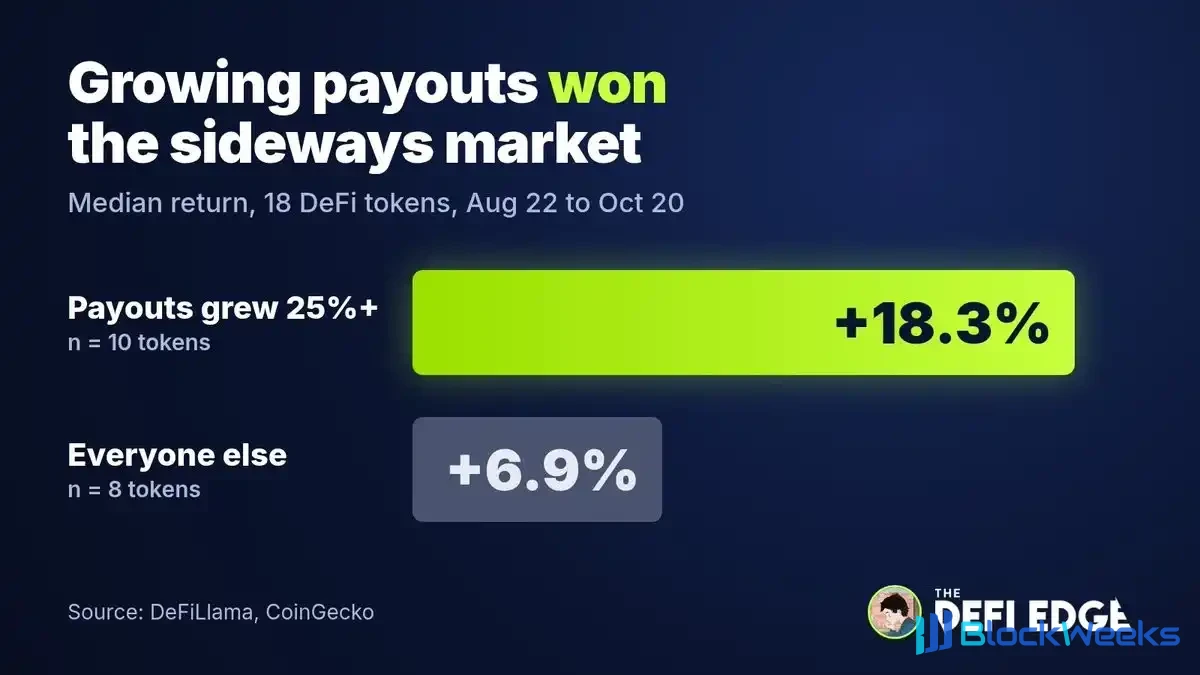
The tokens were divided into two groups for comparison: in the group with dividend growth, the median token gain was 18.3%; the other group was only 6.9%.
The top three tokens all have clear earnings growth logic:
- Raydium: On September 5, tokenized stock issuance platform StonkFun integrated with Raydium's LaunchLab. RAY token buybacks surged from $360,000 in July to $3.94 million in September, an 11-fold increase.
- Uniswap: The fee dividend mechanism had already been activated, and combined with the massive trading volume brought by Robinhood Chain, nearly half of Uniswap's protocol revenue in September came from this public chain.
- Aerodrome (AERO): After the merger of Aerodrome and Velodrome, token holders can receive trading fees as well as fees paid by various projects to purchase liquidity. In September, this portion of revenue reached $14.9 million, already exceeding the $10.5 million paid to liquidity providers.
The reverse also holds true: edgeX's actual earnings distributed to holders fell 15%, and its token price plunged 22%, making it the worst-performing project in the sample.
Does low valuation equal a good opportunity? The data this time gives a different answer, and the result is very surprising. AERO had the lowest valuation multiple at only 8.7x, and its token price surged 77%; edgeX had a valuation of 15x, the second lowest in the sample, yet its performance was dead last. Looking only at whether valuation is high or low simply cannot predict subsequent token price movements.
There are also some tokens that do not fit the above pattern.
- Hyperliquid (HYPE): Earnings distributed to holders surged 79%, but the token price rose only 6%. Valuation based on fully diluted valuation (FDV) is as high as 85x; about $800 million worth of HYPE unlocks and flows out each month, but monthly buybacks are only $75 million, so the market needs to absorb enormous selling pressure.
- Sky (SKY): On August 13, a governance vote passed to use 55% of each period's earnings to buy back tokens and distribute 45% to staking users. Holder earnings nearly quadrupled, but the token price rose only 11%.
- Aave (AAVE): After the rsETH security incident, Aave suspended token buybacks and distributed no dividends to users during the statistical period, yet the token price still rose 24%.
I believe that market pricing looks at both the current dividend level and expectations for future earnings. Dividend expectations are not the only factor affecting token prices.
If Bitcoin enters sideways trading again, how should DeFi tokens be chosen?
When using a project for research, all three of the following must be examined at the same time; none can be omitted:
- The earnings the project actually distributes to token holders are already moving upward.
- There must be actual positive drivers: for example, launching new businesses, activating fee dividends that bring more trading volume, or events such as protocol mergers.
- Be sure to check token unlocks and FDV fully diluted valuation. Hyperliquid is a cautionary tale: once a large number of tokens are unlocked and dumped into the market, it will suppress token price gains.
Some supplementary notes
- This time there are only 19 tokens in the sample and the statistical period is 59 days, so the conclusions are not absolutely convincing. If there were one more month of data, the rankings of mid-tier tokens would likely be completely rewritten.
- Token prices and dividend earnings are counted over the same two-month period. This method is only an observational indicator and does not mean that on August 22 one could accurately select rising tokens using this set of rules.
- The valuation multiples in the article are calculated using circulating market capitalization. Many projects have large amounts of locked tokens, which can make valuations look cheaper than they actually are. Hyperliquid's valuation calculated by circulating market capitalization is 19.6x (circulating market cap $18.1 billion), while calculated by FDV it is as high as 85x (FDV $77.8 billion).
- Holder earnings data comes from DeFiLlama. The data cannot be 100% accurate, but it is already the highest-quality data source in the industry.
- Some projects distribute dividends in batches. For example, Lido's buybacks are executed uniformly after a DAO vote; low earnings in a certain month do not mean the project has stopped distributing dividends.
- Meteora did not participate in the two-group gain comparison because the project's dividend function has just launched and there is no historical data for comparison.
- THORChain's holder earnings come from fee-based burning of RUNE tokens. On September 12, the burn ratio was lowered from 5% to 1%, so its token price fluctuations are unrelated to the logic of dividend growth.
- Supplementary data for anomalous samples. Hyperliquid distributed a total of $146.9 million in earnings to holders during these 59 days, accounting for 59% of the total earnings of all samples; the team unlocks about 9.9 million HYPE per month. Sky's valuation multiple fell from 98x to 28.5x.